UNITED STATES
SECURITIES AND EXCHANGE COMMISSION
Washington, D.C. 20549
_________________________________________
Form
10-K/A
Amendment No. 1
|
(Mark One)
|
||
|
|
ANNUAL REPORT PURSUANT TO SECTION 13 OR 15(d) OF THE SECURITIES EXCHANGE ACT OF 1934
|
|
|
|
For the fiscal year ended
|
|
|
or
|
||
|
|
TRANSITION REPORT PURSUANT TO SECTION 13 OR 15(d) OF THE SECURITIES EXCHANGE ACT OF 1934
|
|
Commission file number:
001-37599

(Exact name of registrant as specified in its charter)
(State or other jurisdiction of
..........
(I.R.S. Employer
incorporation or organization)
........
Identification No.)
(Address of principal executive offices)
.......................
(Zip Code)
Registrant’s telephone number, including area code:
(
44
) (
0
)
203 325-0660
Securities registered pursuant to Section 12(b) of the Act:
|
Title of each class
|
Trading Symbol(s)
|
Name of each exchange on which registered
|
||
|
|
|
|
||
Securities registered pursuant to Section 12(g) of the Act: None
_________________________________________________________________________________________________________________________
Indicate by check mark if the registrant is a well-known seasoned issuer, as defined in Rule 405 of the Securities Act.
Yes
☒
No
☐
Indicate by check mark if the registrant is not required to file reports pursuant to Section 13 or Section 15(d) of the Act. Yes
☐
No
☒
Indicate by check mark whether the registrant (1) has filed all reports required to be filed by Section 13 or 15(d) of the Securities Exchange Act of 1934 during the preceding 12 months (or for such shorter period that the registrant was required to file such reports), and (2) has been subject to such filing requirements for the past 90 days.
Yes
☒
No
☐
Indicate by check mark whether the registrant has submitted electronically every Interactive Data File required to be submitted pursuant to Rule 405 of Regulation S-T (§232.405 of this chapter) during the preceding 12 months (or for such shorter period that the registrant was required to submit such files).
Yes
☒
No
☐
Indicate by check mark whether the registrant is a large accelerated filer, an accelerated filer, a non-accelerated filer, a smaller reporting company, or an emerging growth company. See the definitions of “large accelerated filer,” “accelerated filer,” “smaller reporting company,” and “emerging growth company” in Rule 12b-2 of the Exchange Act.
|
|
☒
|
Accelerated filer
|
☐
|
|
Non-accelerated filer
|
☐
|
Smaller reporting company
|
|
|
Emerging growth company
|
|
||
If an emerging growth company, indicate by check mark if the registrant has elected not to use the extended transition period for complying with any new or revised financial accounting standards provided pursuant to Section 13(a) of the Exchange Act.
☐
Indicate by check mark whether the registrant is a shell company (as defined in Rule 12b-2 of the Act). Yes
☐
No
☒
The aggregate market value of the voting and non-voting common equity held by non-affiliates of the registrant as of June 30, 2019, the last business day of the most recently completed second fiscal quarter, based upon the last sales price reported for such dates on the NASDAQ Global Market was approximately
$
3.5
billion
. For purposes of this disclosure, ordinary shares held by persons who hold more than 5% of the outstanding ordinary shares and shares held by executive officers and directors of the registrant have been excluded as such persons may be deemed to be affiliates.
As of April 23, 2020,
48,579,023
ordinary shares were outstanding.
DOCUMENTS INCORPORATED BY REFERENCE
None
EXPLANATORY NOTE
As required by Rule 12b-15 under the Securities Exchange Act of 1934, as amended (the "Exchange Act"), this Amendment contains new certifications of our Chief Executive Officer and Chief Financial Officer, which are being filed as exhibits to this Amendment. No financial statements are contained in this Amendment so the certifications pursuant to 18 U.S.C. Section 1350 are not included.
Except as set forth in Part III below, no other changes are made to the Original Filing other than updating the cover page of the Original Filing. Unless expressly stated, this Amendment does not reflect events occurring after the filing of the Original Filing, and it does not modify or update in any way the disclosures contained in the Original Filing, including, without limitation, the financial statements. Accordingly, this Amendment should be read in conjunction with the Original Filing and our other filings made with the SEC subsequent to the filing of the Original Filing.
TABLE OF CONTENTS
PART III
ITEM 10. DIRECTORS, EXECUTIVE OFFICERS AND CORPORATE GOVERNANCE.
Background Information Regarding Directors and Director Nominees
|
Name
|
Age
|
Director since
|
Independent
|
Position
|
|
Francesco Bianchi
|
63
|
2015
|
Yes
|
Chairman, Seven Capital Partners S.r.l.
|
|
Stacy Enxing Seng
|
55
|
2019
|
Yes
|
Venture Partner, Lightstone Ventures
|
|
William Kozy
|
68
|
2018
|
Yes
|
Retired, EVP and COO, Becton, Dickinson and Company
|
|
Damien McDonald
|
55
|
2017
|
No
|
Chief Executive Officer, LivaNova
|
|
Daniel Moore
|
59
|
2015
|
Yes
|
Chairman of the Board, Private Investor
|
|
Hugh Morrison
|
73
|
2015
|
Yes
|
Independent Consultant and Private Investor
|
|
Alfred Novak
|
72
|
2015
|
Yes
|
Private Investor
|
|
Sharon O'Kane
|
52
|
2015
|
Yes
|
Entrepreneur in Residence, University College Dublin
|
|
Arthur Rosenthal
|
73
|
2015
|
Yes
|
Retired CEO, EyeCue, Inc.
|
|
Andrea Saia
|
62
|
2016
|
Yes
|
Retired, Global Head of Vision Care, Alcon Division, Novartis AG
|
Francesco Bianchi
has served as the Chairman of Seven Capital Partners S.r.l., a financial consulting firm, since June 2018, previously served as Seven Capital Partners Chief Executive Officer and has been with the firm since 2013. Mr. Bianchi has 30 years of mergers and acquisitions and strategic advisory experience working for well-recognized international financial institutions including JPMorgan Chase (Paris), Morgan Grenfell (London), Citi (Milan) and Bankers Trust (Milan), where he served in various roles including general manager and head of the mergers and acquisitions and corporate finance division. He also headed the strategic planning division of Banca-Intesa S.p.A. in Italy and abroad. Mr. Bianchi earned a degree in economic sciences with honors from the University of Florence and is a chartered accountant.
Committees
: Audit and Compliance; Compensation
Other Public Company Directorships
: None
Former Public Company Directorships During the Past Five Years
: Sorin S.p.A.; Intesa Sanpaulo S.p.A.
Director Skills and Qualifications
: Mr. Bianchi is an audit committee financial expert and has an extensive professional background working in strategy and mergers and acquisitions.
Stacy Enxing Seng
has served as a Venture Partner with Lightstone Ventures, a venture capital group focused on medical technology and biotechnology-related investments, since 2016. Prior to joining Lightstone, Ms. Enxing Seng was with Covidien, a global health care products company, as its President, Vascular Therapies (2011 to 2014) and President of Peripheral Vascular (2010 to 2011). Ms. Enxing Seng joined Covidien in 2010 through the $2.6B acquisition of ev3 Incorporated, where she was a founding member and executive officer responsible for leading its Peripheral Vascular division (2001 to 2010). Prior to ev3, Ms. Enxing Seng held positions of increasing responsibility with Boston Scientific, SCIMED, Baxter and American Hospital Supply. She holds a B.A. in Public Policy from Michigan State University and an M.B.A. from Harvard University.
Committees
: Compensation
Other Public Company Directorships
: Sonova Holding AG; Hill-Rom Holdings, Inc.
Director Skills and Qualifications
: Ms. Enxing Seng has broad experience as a former senior executive responsible for a world-wide business unit of a major medical device company. In addition, she has significant experience as a co-founder of a successful medical device start-up. Her operational experience at both large and small medical device companies, combined with her first-hand experience gained from building ev3 from the ground up, provide the Board with valuable insights into strategy, marketing, sales, innovation, mergers and acquisitions and a variety of other medical device-related areas.
1
William Kozy
retired from Becton, Dickinson and Company, a global medical technology company, in 2016 where he was Executive Vice President and Chief Operating Officer from 2011 to 2016. At Becton Dickinson, he also served as a member of the corporate Leadership Team and in various executive roles since 1988, including head of BD Medical (2009 to 2011), President of the BD Biosciences segment (2006 to 2009), President of BD Diagnostics (2002 to 2006) and Senior Vice President of Company Operations (1998 to 2002). Mr. Kozy graduated
cum laude
from Kenyon College.
Committees
: Nominating and Corporate Governance
Other Public Company Directorships
: Cooper Companies, Inc.
Director Skills and Qualifications
: Mr. Kozy has a career spanning more than 40 years with global medical device companies. Prior to serving as COO for Becton Dickinson, Mr. Kozy’s key business worldwide leadership roles included responsibility for the Biosciences, Diagnostic and Medical segments of Becton Dickinson. During his time at Becton Dickinson, he was responsible for all world-wide businesses of the company with leadership emphasis on profitable revenue growth and talent development. He also brings a depth of corporate leadership experience in the areas of innovation systems, operations, manufacturing and ERP implementation as well as his broad and relevant experience in global strategy, mergers and acquisitions, technology and product development.
Damien McDonald
has served as the CEO and an executive director of the Company since January 2017 and served as the Company’s Chief Operating Officer from October through December 2016. Prior to joining the Company, Mr. McDonald was with Danaher Corporation, a global manufacturer of medical, industrial and commercial products, where he was Group President, Professional Consumables (2013 to 2016). From 2011 to 2013, Mr. McDonald served as Group President of Kerr Corporation, a subsidiary of Danaher, where he was responsible for a dental consumable business with operations in the US, Mexico, Switzerland, Italy and the Czech Republic. In 2010, Mr. McDonald undertook special projects for Danaher. From 2007 to 2010, Mr. McDonald was president, Zimmer Spine at Zimmer Holdings, where he was responsible for divisions in the US and France. From 1999 to 2007, Mr. McDonald had various roles with Johnson and Johnson. Mr. McDonald holds bachelor’s degrees in pharmacy and economics from the University of Queensland in Australia, a master’s degree in international economics from the University of Wales, and an M.B.A. from the Institute for Management Development in Lausanne.
Committees
: None
Other Public Company Directorships
: Avita Medical Limited
Director Skills and Qualifications
: Mr. McDonald has extensive management experience in the medical device and life sciences industries and serves as the CEO of the Company.
Daniel Moore
is Chairman of the Board of the Company and, over the past five years, has served primarily as a private investor. Mr. Moore served as President and CEO and a member of the board of Cyberonics, Inc., a medical device company with core expertise in neuromodulation, from 2007 to 2015 when Cyberonics merged with Sorin S.p.a. to form the Company. Mr. Moore joined Cyberonics after 18 years with Boston Scientific where he was President of InterContinental as well as having roles in general management, sales and marketing earlier in his career. Mr. Moore has a B.A. from Harvard College and an Executive M.B.A. from Boston University.
Committees:
None as Chairman of the Board
Other Public Company Directorships
: GI Dynamics, Inc.; ViewRay, Inc.
Former Public Company Directorships During the Past Five Years
: Cyberonics, Inc.
Director Skills and Qualifications
: Mr. Moore has extensive experience working with cutting edge medical device companies, including leadership of Cyberonics. He has significant experience in domestic and international general management and sales and marketing. Mr. Moore serves or has served on the boards of several medical device companies, the Epilepsy Foundation of America and other non-profits focused on epilepsy, the Medical Device Manufacturers Association and the Advisory Board of Purdue University’s Weldon School of Biomedical Engineering. His board service includes many board chairman roles.
Hugh Morrison
has worked as an independent consultant and private investor since 2012. From 2008 to 2012, Mr. Morrison was a Managing Director at Callahan Advisors, LLC, an investment management company. From 1996 to 2006, he served as President and Chief Executive Officer of Pilgrim Cleaners, Inc., a retail dry cleaning company operating over 100 stores. Mr. Morrison has a BBA in Accounting from Texas A&M University-Kingsville and is a licensed CPA.
Committees
: Audit and Compliance (Chair); Nominating and Corporate Governance
Other Public Company Directorships
: None
Former Public Company Directorships During the Past Five Years
: Cyberonics, Inc.
Director Skills and Qualifications
: Mr. Morrison has extensive board leadership experience in the healthcare sector having served as chairman of the board of Advanced Neuromodulation Systems, Inc. where he gained specific knowledge of neurostimulation device technology and products, and on the boards of Owen Healthcare, Inc. and Dow Hickam Pharmaceuticals, Inc. Mr. Morrison is also an audit committee financial expert.
2
Alfred Novak
has worked as a private investor since 2015. Prior to that, Mr. Novak served as President and CEO of Syntheon Cardiology LLC, an early-stage company developing a percutaneous prosthetic aortic heart valve (2014 to 2015); Chairman and CEO of OrbusNeich Medical Technology Company, Ltd., an interventional cardiology company (2010 to 2013); President and CEO of Novoste Corporation, an interventional cardiology company (2002 to 2006); founder of Syntheon, LLC, a company focused on minimally invasive medical devices for the gastroenterology and vascular markets (1998 to 2003); and President, CEO and a director of Biosense, Inc., an electrophysiology company (1996 to 1998). Prior to that time, Mr. Novak was Vice President and Chief Financial Officer of Cordis Corporation. Mr. Novak received a BS from the United States Merchant Marine Academy and an M.B.A. in Healthcare from The Wharton School of the University of Pennsylvania.
Committees
: Audit and Compliance; Compensation
Other Public Company Directorships
: None
Former Public Company Directorships During the Past Five Years
: Cyberonics, Inc., Dova Pharmaceuticals, Inc.
Director Skills and Qualifications
: Mr. Novak has broad operating executive experience as CEO and CFO as well as leading marketing and sales at medical device companies. In addition, he has board of director experience at medical device and pharmaceutical companies, including service on audit and compensation committees. Further, he has expertise concerning new product development, regulatory approval and commercialization of medical devices. Mr. Novak is also an audit committee financial expert.
Sharon O'Kane
, Ph.D., has served as an Entrepreneur in Residence at University College Dublin since 2015. She was also an expert advisor to the Stevenage Bioscience Catalyst Facility at GlaxoSmithKline, a global healthcare company (2012 to 2019) and a Commercial Mentor to Queen’s University, Belfast (2016 to 2019). Previously, Dr. O’Kane served as Entrepreneur in Residence at the University of Manchester Intellectual Property Company UMIP (2009 to 2014). Dr O’Kane co-founded and, from 1998 to 2010, was the Chief Scientific Officer, and a Director of Renovo Group Plc, a UK biotech company. Dr. O’Kane earned a B.Sc (Honours) First Class in Biomedical Sciences from the University of Ulster from which she also earned a Ph.D. in Biomedical Sciences. She also earned a Diploma in Company Direction from the Institute of Directors.
Committees
: Nominating and Corporate Governance (Chair)
Other Public Company Directorships
: None
Director Skills and Qualifications
: Dr. O’Kane has extensive experience in healthcare, both in the academic realm and in research and development (R&D) capacities. She has served on the board of directors of several biotech and healthcare companies and organizations and has held numerous positions advising healthcare and biotech companies, governmental bodies and universities. Dr. O’Kane was also a co-founder, Chief Science Officer and executive director of Renovo Group Plc and was responsible for growing the university spin-out to a public company, and a non-executive director of Iomet Pharma Ltd. Dr. O’Kane has had corporate director governance training at the Institute of Directors and Harvard Business School.
Arthur Rosenthal
, PhD retired from EyeCue, Inc., a development-stage medical device company working on a guided biopsy for lower and upper gastrointestinal cancer screening, after serving as co-founder and CEO from 2011 to 2015. Dr. Rosenthal also served as Professor of Practice in the Biomedical Engineering Department at Boston University from 2010 to 2015. Prior to co-founding EyeCue in 2011, Dr. Rosenthal served as President and CEO of Cappella, Inc., a development-stage company focused on novel device solutions for coronary artery disease (2009 to 2011); CEO of Labcoat, Ltd., a development-stage drug-eluting stent technology company, from 2005 until its acquisition by Boston Scientific Corporation in 2008; Senior Vice President, Chief Science Officer and Executive Committee Member of Boston Scientific, a medical device manufacturer (2000 to 2005); and Senior Vice President, Corporate Officer and Chief Development Officer at Boston Scientific (1994 to 2000). Dr. Rosenthal earned his Bachelor Degree in Bacteriology from the University of Connecticut and a Ph.D in Biochemistry from the University of Massachusetts.
Committees
: Compensation (Chair)
Other Public Company Directorships
: Profound Medical Corp.
Former Public Company Directorships During the Past Five Years
: Cyberonics, Inc.; Arch Therapeutics, Inc.
Director Skills and Qualifications
: For more than 40 years, Dr. Rosenthal has developed medical device technologies as an individual contributor, technology executive and serial entrepreneur. He has extensive knowledge of regulatory and compliance requirements pertaining to medical devices and experience with new product development and technology commercialization as well as having served as an operating executive with a major medical device manufacturer.
Andrea Saia
served as the Global Head of Vision Care in the Alcon Division of Novartis AG, a global healthcare company, from 2011 until her retirement in 2012. Prior to this role, she served as President and CEO of CibaVision Corporation, a subsidiary of Novartis, from 2008 to 2011. From 2005 to 2007, Ms. Saia relocated to Switzerland and served as President of Europe, Middle East and Africa operations, CibaVision’s largest regional business unit. She joined CibaVision in 2002 as Global Head of Marketing and was promoted
3
to President of the Global Lens Business in 2003. Prior to joining Novartis, Ms. Saia was the Chief Marketing Officer for GCG Partners and also held senior management and marketing positions with global consumer products companies such as Procter & Gamble Co., Unilever and Revlon, Inc. Ms. Saia earned her B.S. in Business Administration from Miami University and her M.B.A. from J.L. Kellogg Graduate School of Management.
Committees
: Audit and Compliance
Other Public Company Directorships
: Align Technology
Former Public Company Directorships During the Past Five Years
: Coca Cola Enterprises
Director Skills and Qualifications
: Ms. Saia is an accomplished global business executive with nearly 40 years’ experience in the medical device and consumer products industries including multinational companies such as Novartis, Unilever, Revlon and Procter & Gamble, and continuing involvement in business matters as a member of the Miami University Farmer School of Business Advisory Board. She has extensive global business experience, a broad understanding of healthcare, medical device and consumer products industries, strong management skills and significant operations experience.
Executive Officers
|
Name
|
Age
|
Position
|
|
Damien McDonald
|
55
|
Chief Executive Officer
|
|
Thad Huston
|
50
|
Chief Financial Officer
|
|
Keyna Skeffington
|
58
|
Senior Vice President, General Counsel and Corporate Secretary
|
|
Edward Andrle
|
62
|
Former General Manager, Neuromodulation Franchise
|
|
Alistair Simpson
|
50
|
Former General Manager, Cardiovascular Franchise
|
|
Marco Dolci
|
58
|
Head of Global Operations and R&D
|
|
Trui Hebbelinck
|
48
|
Chief Human Resources Officer
|
|
Roy Khoury
|
46
|
President, International, Senior Vice President, Global Strategic Marketing
|
Damien McDonald
’s biographical information is set forth under "
Background Information Regarding Directors and Director Nominees."
Thad Huston
joined LivaNova in May 2017 as Chief Financial Officer. Mr. Huston served as Group Chief Financial Officer, Medical Devices & Global Surgery Group at Johnson & Johnson, a global consumer health products company, from 2013 to 2017. From 2010 to 2013, Mr. Huston served as President of Johnson & Johnson’s Xian-Janssen Pharmaceuticals division in China. Prior to this, Mr. Huston served as Vice President, Finance, Chief Financial Officer and Chief Operations Officer in Johnson & Johnson's Pharmaceutical Research and Development division and as Vice President, Finance and Chief Financial Officer at Ortho-McNeil Pharmaceuticals. Prior to this, he held senior financial roles at various Johnson & Johnson locations in the US, China, Belgium, Russia and Hungary. Mr. Huston holds a bachelor’s degree in Finance from Pennsylvania State University. He is a Certified Management Accountant.
Keyna Skeffington
joined LivaNova in June 2017 in the role of Senior Vice President and General Counsel and became Company Secretary in October 2019. Prior to joining the Company, Ms. Skeffington served in various roles at Medtronic Plc from 2004 to 2017, most recently as Vice President of Legal - Corporate and Securities and Assistant Secretary (2006 to 2017). She also
served as Senior Legal Counsel for Medtronic’s Cardiac Surgery Business from 2005 to 2006. Before joining Medtronic, Ms. Skeffington was a Partner at the firm now known as Faegre Drinker Biddle & Reath LLP. Ms. Skeffington holds a BA in International Relations and Russian from Mount Holyoke College and a JD from Tulane University Law School.
Edward Andrle
joined LivaNova in 2015 when Cyberonics merged with Sorin to form the Company. Mr. Andrle now serves as a special advisor to the Company, a role he has had since January 1, 2020. Mr. Andrle's initial role with the Company was as General Manager of the Neuromodulation franchise. At Sorin, Mr. Andrle served as Vice-President of Strategy & Business Development. Prior to joining Sorin, he co-founded, developed and sold three medical device companies:TERAMED focused on an endovascular system to treat abdominal aortic aneurysms and was acquired by Johnson & Johnson; Myocor developed an implantable device to treat mitral valve regurgitation and was acquired by Edwards; and StarFire Medical developed technology to treat brain aneurysms and was
4
acquired by NFocus Neuromedical (Covidien). Mr. Andrle holds a B.S. in Chemical Engineering from the University of Notre Dame and an M.B.A. from the Stanford Graduate School of Business.
Alistair Simpson
joined LivaNova in April 2017 in the role of General Manager, Cardiovascular. Mr. Simpson now serves as a special advisor to the Company, a role he has had since January 1, 2020. Prior to joining the Company, Mr. Simpson was Vice President Global Marketing at Kerr Corporation, a subsidiary of Danaher Corporation, where he was responsible for strategy and product development for the consumable franchise. Earlier in his career he spent 16 years with Johnson & Johnson in various strategic and commercial roles both in Europe and North America, within the Ethicon and Cordis franchises where he held marketing leadership roles in the suture business and the interventional cardiology business. Mr. Simpson holds a B.S. in Geography from the University of Glasgow, Scotland and an M.B.A. from the University of Pittsburgh.
Marco Dolci
joined LivaNova in March 2017 as President, Europe and subsequently became President, Europe and Head of Global Manufacturing Operations (December 2018 to January 2020) and has been in his current role as Head of Global Operations and R&D since January 2020. Prior to joining the Company, Mr. Dolci was with Danaher Corporation as its Vice President of Danaher Business System - Dental Consumable Platform (April 2016 to March 2017); President of Global Digital Dentistry (November 2014 to April 2016); President - Dental Consumable Platform - EMEA, Asia and Pacific Region (December 2012 to December 2014); and President, Kerr EMEA (October 2010 to December 2012). Prior to his tenure at Danaher, Mr. Dolci served as President and CEO, EMEA for Hitachi Medical System Europe Holding AG. Earlier in his career, he worked in various positions at Eastman Kodak S.A. - Health Care Division, GE Healthcare and Philips Medical Systems. Mr. Dolci holds a master's degree in nuclear physics from University of Milan and an Executive M.B.A. from Polytechnic University of Milan.
Trui Hebbelinck
joined LivaNova in March 2019 as the Company's Chief Human Resources Officer and oversees global human resources. Prior to joining LivaNova, Ms. Hebbelinck served as VP, Human Resources Trading & Supply with Royal Dutch Shell plc, a global petrochemical company, from September 2015 to March 2019 and as its VP HR Operations UK, Ireland, Nordics, South Africa from January 2014 to September 2015. Prior to Shell, Ms. Hebelinck served as VP, HR International with General Electric Corporation and in Human Resources with GE Capital Real Estate and GE Healthcare. Ms. Hebbelinck earned a Master of Science in Psychology from Ghent University and a post-graduate degree in Business Management & Administration from the University of Leuven.
Roy Khoury
joined LivaNova in June 2016 as President, International Markets and was promoted to his current role, Senior Vice President, Global Strategic Marketing in January 2020. From August 2015 to July 2016, Mr. Khoury served as a Senior Healthcare Consultant. Prior to that, Mr. Khoury spent more than eight years in various roles at Allergan Pharmaceuticals, a global pharmaceutical company, including as Vice President Commercial Operations, International Markets (September 2014 to July 2015); Senior Director, Marketing Neurosciences and Urology, EMEA (July 2012 to September 2014); Business Unit Head/General Manager Ophthalmology Emerging Markets EMEA (November 2009 to September 2012); and Group Lead Marketing Manager Europe/Africa/Middle East (June 2008 to February 2010). Earlier in his career, he held manager and director positions with Novartis Pharmaceuticals Ltd. UK and ApotheCom Associates LLC. Mr. Khoury has a degree in Business Administration from LaSalle with minors in English literature and biology.
Family Relationships
There are no family relationships among any of our directors or executive officers.
Delinquent Section 16 Reports
Section 16(a) of the Exchange Act requires our officers and directors, and persons who beneficially own more than 10% of a registered class of our equity securities, to file reports of ownership on Form 3 and changes in ownership on Form 4 or Form 5 with the SEC. Such officers, directors and greater-than-10% shareholders are also required by securities laws to furnish us with copies of all Section 16(a) forms they file.
Based solely on a review of Forms 3, 4, and 5 (including amendments to such forms) furnished to us during and with respect to the year ended December 31, 2019, no director, officer or beneficial owner of more than 10% of our registered shares failed to file on a timely basis reports required by Section 16(a) of the Exchange Act in the year ended December 31, 2019 with the exception of one Form 3 that, as a result of an administrative error, failed to include certain derivative securities owned by Trui Hebbelinck. Additionally, it was determined that a Form 3 filed to report securities owned by Keyna Skeffington on July 27, 2017 failed to include certain derivative securities as a result of an administrative error. The Form 3 filings of Ms. Hebbelinck and Ms. Skeffington were amended to report such derivative securities.
Code of Business Conduct and Ethics
The Board has adopted a Corporate Code of Business Conduct and Ethics (the "Code") for all directors, executive officers and other employees, agents and representatives. The Code is designed to deter wrongdoing and to promote honest and ethical conduct, including the ethical handling of actual or apparent conflicts; full, fair, accurate, timely and understandable disclosure in reports and documents that we file with, or submit to, the SEC and in other public communications made by us; compliance with applicable
5
governmental laws, rules and regulations; the prompt internal reporting of violations of the Code; and accountability for adherence to Code. A copy of the Code is available on our website at
www.livanova.com
. Any change to, or waiver from, the Code will be disclosed as required by applicable securities laws, which disclosure may occur on our website or by filing a Form 8-K.
Director Selection
The selection process for directors is set out in our Corporate Governance Guidelines and in the charter of the Nominating and Corporate Governance Committee. These documents are available at https://investor.livanova.com. There have been no material changes to the procedures by which security holders may recommend nominees to the Board of Director since the filing of the Company's proxy statement in connection with the 2019 AGM.
Audit and Compliance Committee
Under its charter, the Audit and Compliance Committee’s key responsibilities include:
|
•
|
reviewing our consolidated financial statements and internal controls with management and the independent auditors;
|
|
•
|
monitoring actions we take to comply with our internal accounting and control policies as well as external financial, legal and regulatory requirements;
|
|
•
|
monitoring our internal audit functions;
|
|
•
|
reviewing the qualifications and independence of our independent auditors engaged for the purpose of auditing our consolidated financial statements and issuing an audit report for inclusion in appropriate regulatory filings; and
|
|
•
|
selecting, subject to required shareholder approvals, our independent auditors and evaluating their performance.
|
The Audit and Compliance Committee meets at least quarterly with management, the Chief Ethics and Integrity Officer, internal auditors and the independent auditors in separate executive sessions to discuss any matter that any of these groups believe should be discussed privately. Pursuant to its charter, the Audit and Compliance Committee has the authority, at the Company’s expense, to retain professional advisors, including legal, accounting or other consultants, to advise it in connection with the exercise of its powers and responsibilities. This committee is also responsible for engaging and providing for appropriate compensation of the independent auditors.
The Board has also determined that all members of the Audit and Compliance Committee meet additional, heightened independence criteria applicable to audit committee members under the Nasdaq listing rules. The Board has further determined that all members of the Audit and Compliance Committee are financially literate and that Francesco Bianchi, Hugh Morrison (chair of the Audit and Compliance Committee) and Alfred Novak are “audit committee financial experts."
Audit and Compliance Committee Report
The Audit and Compliance Committee is comprised of four non-employee directors, all of whom are “independent” under the applicable Nasdaq rules and the applicable rules of the SEC. The Audit and Compliance Committee is governed by a written charter which has been adopted by the Board.
Our management team is responsible for the preparation, presentation, and integrity of the consolidated financial statements, maintaining a system of internal controls and having appropriate accounting and financial reporting principles and policies. The independent registered public accounting firm is responsible for planning and carrying out an audit of the consolidated financial statements and an audit of internal control over financial reporting in accordance with the rules of the Public Company Accounting Oversight Board (United States) and expressing an opinion as to the consolidated financial statements’ conformity with US generally accepted accounting principles (“GAAP”) and as to internal control over financial reporting. The Audit and Compliance Committee monitors and oversees these processes and is responsible for selecting and overseeing our independent registered public accounting firm. As part of the oversight process, the Audit and Compliance Committee met ten times in 2019 and acted via written resolutions on one occasion. Throughout the year, the Audit and Compliance Committee met with our independent registered public accounting firm, management and internal auditor, both together and separately in closed sessions. In the course of fulfilling its responsibilities, the Audit and Compliance Committee did, among other things, the following:
|
•
|
reviewed and discussed with management and the independent registered public accounting firm our consolidated financial statements for the year ended December 31, 2019 and the quarters ended March 31, 2019, June 30, 2019 and September 30, 2019;
|
6
|
•
|
oversaw and discussed with management the review of internal control over our financial reporting;
|
|
•
|
reviewed management’s representations that our consolidated financial statements were prepared in accordance with GAAP and present fairly our results of operations and financial position;
|
|
•
|
discussed with the independent registered public accounting firm the matters required to be discussed by Auditing Standard No. 1301, Communications with Audit Committee;
|
|
•
|
received the written disclosures and letter from the independent registered public accounting firm required by the applicable requirements of the Public Company Accounting Oversight Board regarding the independent registered public accounting firm’s communication with the Audit and Compliance Committee concerning independence, and discussed with the independent registered public accounting firm its independence;
|
|
•
|
reviewed and evaluated the performance and quality of the independent registered public accounting firm and its lead audit partner in its determination to recommend the retention of the independent registered public accounting firm, including by assessing the performance of the independent registered public accounting firm from within the Audit and Compliance Committee and from the perspective of senior management and the internal auditor;
|
|
•
|
considered whether the provision of non-audit services by our registered public accounting firm is compatible with maintaining the registered public accounting firm’s independence;
|
|
•
|
reviewed the scope of and overall plans for the annual audit and the internal audit program;
|
|
•
|
reviewed new accounting standards applicable with our CFO, internal audit department and our external auditors;
|
|
•
|
consulted with management with respect to our processes for risk assessment and risk mitigation;
|
|
•
|
reviewed our processes for monitoring compliance with the law and Company policies and Code of Business Conduct and Ethics; and
|
|
•
|
reviewed and discussed with management its assessment and report on the effectiveness of our internal control over financial reporting as of December 31, 2019.
|
Based on its review and report on the Company’s internal control over financial reporting as of December 31, 2019, the Audit and Compliance Committee recommended to the Board that the audited consolidated financial statements be included in the Company’s US Annual Report on Form 10-K for the year ended December 31, 2019.
Compensation Committee Interlocks
During the year ended December 31, 2019, the Compensation Committee was composed of Arthur L. Rosenthal (chairman), Francesco Bianchi, Stacy Exing Seng and Alfred J. Novak. No member of the Compensation Committee is now, or at any time has been, employed by or served as an executive officer of the Company or any of its subsidiaries, or has had any substantial business dealings with the Company or any of its subsidiaries. None of our executive officers currently serves or served in the year ended December 31, 2019 on the board of directors or compensation committee of another company at any time during which an executive officer of such other company served on our Board or Compensation Committee.
ITEM 11. EXECUTIVE COMPENSATION.
Compensation Committee Report
Set out below is the Compensation Discussion and Analysis, which is a discussion of our executive compensation programs and policies written from the perspective of how we and management view and use such programs and policies. Given the Compensation Committee’s role in providing oversight of the design of those programs and policies, and in making specific compensation decisions for senior executives using those policies and programs, the Compensation Committee participated in the preparation of the Compensation Discussion and Analysis, reviewing successive drafts of the document and discussing those with management. The Compensation Committee recommended to the Board that the Compensation Discussion and Analysis be included in the Form 10-K and proxy statement. We join with management in welcoming shareholders to examine our pay practices and in affirming the commitment of these pay practices to the long-term interests of shareholders. The Compensation Committee has reviewed and discussed the disclosure set forth below under the heading “Compensation Discussion and Analysis” with management and, based on the review and discussions, it has recommended to the Board that the “Compensation Discussion and Analysis” be included in a Form 10-K and our proxy statement for the 2020 AGM.
Francesco Bianchi
Stacy Enxing Seng
Alfred Novak
Arthur Rosenthal, Ph.D. (chair)
7
Compensation Discussion & Analysis
This Compensation Discussion and Analysis (“CD&A”) describes our executive compensation programs for our Named Executive Officers (“NEOs”) and the oversight by the Compensation Committee in setting executive compensation for the year ended December 31, 2019. This CD&A supplements and should be read together with the compensation tables and related disclosure following this CD&A.
Our Named Executive Officers
Our Named Executive Officers ("NEOs") for the year ended December 31, 2019 are:
|
•
|
Damien McDonald, CEO;
|
|
•
|
Thad Huston, CFO;
|
|
•
|
Keyna Skeffington, SVP, GC and Corporate Secretary;
|
|
•
|
Edward Andrle, Former GM, Neuromodulation Franchise; and
|
|
•
|
Alistair Simpson, Former GM, Cardiovascular Franchise.
|
CD&A Executive Summary
Our market-competitive executive compensation program attracts and retains executives who perform at a high level and contribute to the success of the Company. It also provides strong financial incentives for the NEOs to increase shareholder value. To accomplish this, the Company pays its NEOs a base salary in cash; a bonus in cash in the event the metrics of the Short-Term Incentive Plan (“STIP”) are met; equity in the form of service-based awards and performance-based awards; and other employment benefits. All of these are more fully described in this CD&A and in the narrative and tables included herein.
Company Performance in the Year Ended December 31, 2019
The year ended December 31, 2019 was a challenging one for the Company. Our 2019 Short-Term Incentive Plan ("STIP") had financial objectives, non-financial objectives and, for most NEOs, leadership objectives. None of the financial objectives were achieved for the STIP and, consequently, the payout related to the financial objectives was zero for all our NEOs, other than Mr. Simpson. The Compensation Committee determined that the performance of the Cardiovascular segment warranted recognition because the threshold was missed by a very slight margin and awarded Mr. Simpson a discretionary payment at the threshold level. All the non-financial objectives were achieved with the exceptions of one Regulatory project and the Commercialization element, leading to a 30% achievement at Target. However, given the Company's overall financial results, the Compensation Committee reduced the payout under the STIP to 25% at Target. The Leadership objectives were achieved by each of the NEOs, but due to the Company's performance, management recommended and the Compensation Committee approved, that payout of this portion be at 80% of target for Mr. Huston and Ms. Skeffington and at 70% of target for Mr. Andrle and Mr. Simpson. Achievements for Mr. Andrle and Mr. Simpson were considered at 70% given their departures from their roles within the Company. This resulted in the following payouts in relation to the leadership objective: Mr. Huston at 80% (resulting in a payment of 12% of Target (80% of 15%)); Ms. Skeffington at 80% (resulting in a payment of 12% of Target (80% of 15%)); Mr. Andrle at 70% (resulting in a payout of 14% of Target (70% of 20%); and Mr. Simpson at 70% (resulting in a payment of 14% of Target (70% of 20%)).
In the year ended December 31, 2019:
|
•
|
The Company’s total net sales were $1,084.2 million versus $1,107.0 in 2018, a decrease of 2.1% from 2018;
|
|
•
|
Cardiovascular sales were $656.6 million, a 0.7% decrease from 2018;
|
|
*
|
Sales in cardiopulmonary products were $504.7 million, a 3.1% decrease from 2018, primarily due to the impact of exiting a Canadian distribution agreement and a component supplier issue related to the Inspire oxygenator;
|
|
*
|
Heart valve sales, including tissue and mechanical heart valves, were $120.0 million, a decrease of 0.7% compared to 2018; and
|
|
*
|
Advanced Circulatory Support (“ACS”) sales were $31.9 million, an increase of 64.1%, primarily related to growth in ProtekDuo and one additional quarter of sales in 2019 versus 2018 since the acquisition of TandemLife in April 2018;
|
|
•
|
Neuromodulation sales were $424.5 million, a 1.2% increase compared to 2018, primarily driven by adoption of the SenTiva VNS Therapy System and very strong growth in the Europe and Rest of World regions; and
|
|
•
|
The full year operating loss from continuing operations was $168.9 million and adjusted operating income from continuing operations was $179.7 million, a decrease of 16.9% as compared to 2018, primarily impacted by performance in Neuromodulation, investments in research and development to support Strategic Portfolio Initiatives,
|
8
commercial investments in ACS and the Rest of World region, offset somewhat by favorable product mix and gross margin improvements.
Actions in 2019 to Contribute to Future Revenue
While LivaNova's 2019 financial results were disappointing, numerous management actions and other prior-year efforts bore fruit that will contribute to the Company’s success in the future.
|
•
|
In February 2019, the US Centers for Medicare & Medicaid Services (“CMS”) finalized its National Coverage Determination for the Vagus Nerve Stimulation (“VNS”) Therapy System for difficult to treat depression ("DTD") which initiates coverage for Medicare beneficiaries through Coverage with Evidence Development when offered in a CMS-approved, double-blind, randomized placebo-controlled trial with a follow-up duration of one year, as well as coverage for VNS Therapy device replacement.
|
|
•
|
In July 2019, we launched Bi-Flow, our innovative arterial femoral cannula, which received CE Mark in early 2019 and is the only bidirectional arterial cannula designed to prevent leg ischemia during cardiac surgery procedures requiring femoral artery cannulation.
|
|
•
|
In July 2019, we acquired Miami Instruments, LLC’s minimally invasive cardiac surgery instruments business for cash consideration of up to $17.0 million.
|
|
•
|
In July 2019, the US Food and Drug Administration approved our LifeSPARC system, a new generation of the ACS pump and controller and we began a limited commercial release in the US.
|
|
•
|
In September 2019, CMS accepted the protocol for our RECOVER clinical study, evaluating VNS Therapy for DTD. RECOVER is a double-blind randomized, placebo-controlled study with a follow-up duration of at least one year. RECOVER will include up to 500 unipolar and up to 500 bipolar patents at a maximum of 100 sites in the US.
|
Shareholder Engagement and Consideration of Prior Year’s Say on Pay Vote
We are committed to engagement with our shareholders on executive compensation and corporate governance matters and review all shareholder input and feedback.
At the 2019 AGM, the vote on "Say on Pay" regarding NEO compensation garnered shareholder support of 95.40%. The advisory vote on the UK directors' remuneration report regarding executive and non-executive director remuneration also showed strong support with 95.55% approval. The Compensation Committee reviewed shareholder and other stakeholder feedback along with the results of each of these votes and incorporated it when making compensation decisions.
Under English company law, we are obliged to adopt a remuneration policy for our directors, including our CEO, who is also our sole executive director. The remuneration policy received the support of 96.05% of the shareholders in 2019. This policy remains in force until the 2022 AGM when a new remuneration policy will be presented to shareholders for their approval.
Executive Compensation Philosophy
The Compensation Committee has structured the Company’s executive compensation program to be an incentive for our NEOs to perform at their highest level, take appropriate risks and drive shareholder return in the short and long term. We determine the compensation strategy for our NEOs and oversee its operation to ensure our goals - shareholder alignment, rewarding appropriate performance and competitive pay - are achieved in practice.
Our executive compensation program aims to ensure that we recruit and retain key executive officers responsible for our success and align the interests of our executive officers, including our NEOs, with shareholders. To achieve these ends, the Compensation Committee structures the executive compensation program to:
|
•
|
Target NEO pay around the market median to attract, motivate and retain talented executive officers with the skills and experience to ensure our long-term success;
|
|
•
|
Use multiple pay and award vehicles that work together to reward performance and retain talent, while maintaining alignment with shareholder interests;
|
|
•
|
Reward individual performance with base salary and a cash-based short-term bonus while ensuring a meaningful link to our operational performance and shareholder interests;
|
|
•
|
Pay a substantial portion of each NEO’s compensation as variable pay contingent upon the achievement of our business objectives;
|
9
|
•
|
Balance the components of compensation so that short-term (annual) and long-term performance objectives are recognized because our success depends on our executive officers being focused on critical strategic and tactical objectives, both short-term and long-term;
|
|
•
|
Encourage NEOs to have a meaningful ownership interest in the Company with stock ownership guidelines;
|
|
•
|
Vest equity awards over time to promote retention and mitigate risks;
|
|
•
|
Have clawback provisions in our plans to mitigate risks; and
|
|
•
|
Work with an independent compensation consultant to ensure our program is meeting its goals.
|
The Compensation Committee further aligns the executive compensation program with shareholder interests by:
|
•
|
Having a double trigger change in control provision before cash severance may be paid;
|
|
•
|
Prohibiting excise tax gross-up payments;
|
|
•
|
Prohibiting stock option repricing and discounted stock option grants;
|
|
•
|
Not allowing our officers or directors to pledge their LivaNova stock, subject to a transition period to unwind any existing obligations;
|
|
•
|
Prohibiting hedging transactions of any type of Company security, including without limitation puts, calls, equity swaps, collars, exchange funds, prepaid variable forwards or other financial instruments or derivative securities; and
|
|
•
|
Allocating 50% of NEO long-term incentives to performance-based awards.
|
Participants in Executive Compensation Design and Decision-Making Process
Role of the Compensation Committee
The Compensation Committee determines our compensation philosophy, program design and is the decision-making body on all matters relating to the compensation paid to our NEOs. The Compensation Committee has the sole authority to retain and terminate a compensation consultant to assist with its responsibilities as well as the sole authority to approve the compensation consultant’s fees, which the Company pays.
Role of the Compensation Consultant
The Compensation Committee directly engages a compensation consultant, Pearl Meyer & Partners, LLC (“Pearl Meyer”), to advise it on competitive pay practices, determine our peers for compensation purposes, provide market data and assist us in the analysis of that data. Pearl Meyer is independent of the Company and does not perform any services for the Company or any of its executive officers or other employees.
Role of the CEO
Our Compensation Committee works with our executive management, including our CEO, to oversee our executive compensation program. Our CEO plays a key role in the process as it relates to executive officers other than himself. For the NEOs other than himself, our CEO:
|
•
|
recommends performance objectives for our annual STIP;
|
|
•
|
recommends adjustments to annual base salaries and target amounts under our STIP;
|
|
•
|
recommends equity incentive awards under our long-term incentive plan (“LTIP”);
|
|
•
|
prepares an evaluation of each executive officer; and
|
|
•
|
prepares an analysis of performance objective achievements and recommends annual bonus amounts.
|
With respect to himself, our CEO prepares a self-evaluation that is reviewed by the Compensation Committee and used by the Compensation Committee in setting his compensation.
How We Establish Executive Compensation Levels
In making executive compensation determinations, the Compensation Committee relies on several factors to set compensation elements and compensation targets consistent with our executive compensation program objectives. These factors include:
|
•
|
Assessment of Company Performance.
The Compensation Committee establishes specific, measurable company performance objectives that the Board, the Compensation Committee and management believe will drive shareholder value. Achievement or failure to achieve those performance objectives determines substantially all of
|
10
the pay-outs under the STIP (individual objectives may also be relevant depending on the year) and the lapsing or not of forfeiture restrictions on performance-based equity incentive awards under the LTIP.
|
•
|
Assessment of Individual Performance.
Individual performance has a strong impact on compensation.
|
|
*
|
CEO
. The Compensation Committee meets with our CEO at the beginning of the year to agree on the CEO’s performance objectives for the year. At the end of the year, the Compensation Committee and the chairman of the Board meet in executive session to assess the CEO’s performance against his performance objectives, his contribution to our performance, his ethics and integrity and other leadership attributes
.
|
|
*
|
Other NEOs
. For all other NEOs, the Compensation Committee receives performance assessments and compensation recommendations from the CEO and also exercises its judgment based on the Board’s interactions with the individuals. As with the CEO, an executive officer’s performance assessment is based on individual achievements and contributions, contribution to our company’s performance, ethics and integrity and other leadership accomplishments
.
|
|
•
|
Benchmarking Analysis.
The Compensation Committee reviews peer-group data as a market check for compensation decisions, but does not base compensation targets on peer-group data alone. The Compensation Committee compares the overall pay of individual NEOs to the most relevant benchmarking data available from its independent advisor, Pearl Meyer. The NEO’s pay is driven primarily by individual and Company performance, as well as internal pay equity; peer group data is used as a market check to compare individual pay to the broad middle range (25th to 75th percentile) of peer group pay. The Compensation Committee typically seeks to maintain base salary toward the middle of peer group pay, but will permit annual bonus opportunities and long-term equity incentive awards to approach the upper end of the broad middle range when justified by individual and Company performance. Pearl Meyer uses the peer group companies as well as survey data from Radford to perform the benchmark analysis.
|
The peer group used to benchmark executive compensation for the year ended December 31, 2019 consisted of 20 companies (the “2019 Peer Group”) selected by the Compensation Committee with advice from its independent compensation consultant, Pearl Meyer, as follows:
|
Abiomed, Inc.
|
Masimo Corporation
|
|
Cantel Medical Corp.
|
Merit Medical Systems, Inc.
|
|
CONMED Corporation
|
Nuvasive, Inc.
|
|
DexCom, Inc.
|
ResMed Inc.
|
|
Globus Medical, Inc.
|
STERIS plc
|
|
Hill-Rom Holdings, Inc.
|
Teleflex Incorporated
|
|
Hologic, Inc.
|
The Cooper Companies, Inc.
|
|
ICU Medical, Inc.
|
Varian Medical Systems, Inc.
|
|
Integer Holdings, Corporation
|
West Pharmaceutical Services, Inc.
|
|
Integra LifeSciences Holdings Corporation
|
Wright Medical Group, N.V.
|
|
•
|
Overall Competitiveness
. The Compensation Committee uses aggregated market data from the Radford survey data as well as the peer group as a reference point to ensure that executive compensation falls within the broad middle range of comparable pay at peer companies with which the Company competes for talent.
|
|
•
|
UK Remuneration Policy
.
For our CEO, who is also a director, the Compensation Committee must ensure that any compensation plan it approves for him is consistent with our shareholder-approved UK remuneration policy. Under English company law, we were obliged to adopt a remuneration policy for our directors, including our CEO, who is also a director. Under that shareholder-approved remuneration policy, our CEO's maximum short-term incentive opportunity cannot exceed 200% of his base salary. In the case of a calculated payment higher than 200%, the Compensation Committee would affirmatively act to reduce the award to not exceed 200% of his base salary in compliance with the UK remuneration policy.
|
Executive Compensation Program Design
We do not currently have, and we do not expect to have, formal policies relating to the allocation of total compensation among the various elements of our compensation program (other than for our CEO who, as a director, is subject to the shareholder-approved remuneration policy). We intend to continue to evaluate the mix of base salary, short-term incentive compensation and long-term incentive compensation to appropriately align the interests of our NEOs with those of our shareholders.
The executive compensation program currently consists of the following:
11
|
Element and Purpose
|
Key Features
|
|
Base Salary
Purpose: Attract and retain NEOs; compensate for individual performance
|
Fixed annually at the beginning of the financial year by the Compensation Committee
Measured against compensation peer group
Serves as the baseline from which short-term incentives are calculated
|
|
Short-Term Incentives
Purpose: Provide formulaic incentives to achieve or exceed budgeted Adjusted Net Sales (1) and Adjusted Net Income (2) and drive non-financial initiatives supporting our success
|
Annual cash-based bonus plan expressed as a percentage of the NEO’s weighted average base salary
Incentive payouts range from threshold to maximum levels, depending on level of performance measured against Compensation Committee determined metrics
Bonus payment based on the achievement of two financial objectives - budgeted Adjusted Net Sales and Adjusted Net Income - eight non-financial objectives relating to: design, clinical, regulatory and commercialization projects; and, with the exception of Mr. McDonald, leadership
|
|
Long-Term Incentives
Purpose: Create alignment with shareholder interests; motivate, attract and retain top talent
|
Service-Based Awards
:
Restricted Stock Units vest in equal or substantially equal amounts on each of the first four anniversaries of the grant date
Stock Appreciation Rights vest in equal or substantially equal amounts on each of the first four anniversaries of the grant date
Performance-Based Awards
:
Relative Total Shareholder Return Performance Stock Units are subject to a three-year relative total shareholder return market condition
Adjusted Free Cash Flow Performance Stock Units are subject to achievement of a three-year cumulative adjusted free cash flow target
|
|
(1)
|
Adjusted Net Sales are our net sales at budgeted currency exchange rates, excluding net sales from acquisitions.
|
|
(2)
|
Adjusted Net Income is our non-GAAP net income at reported currency exchange rates, after adjustments for the effects of acquisitions, divestitures, restructuring, integration, purchase price allocation and intangible amortization, special items, including 3T Heater Cooler remediation and significant and unusual litigation, including 3T Heater Cooler litigation, and equity compensation.
|
2019 Compensation
Compensation Committee Actions - 2019
The Compensation Committee took the following actions in 2019:
|
•
|
Approved the 2019 STIP and the 2019 LTIP;
|
|
•
|
Re-appointed Pearl Meyer as its compensation advisor for the 2019 financial year;
|
|
•
|
Approved base salaries and STIP percentages for all NEOs; and
|
|
•
|
Amended the Employee Stock Purchase Plan to eliminate open market purchases.
|
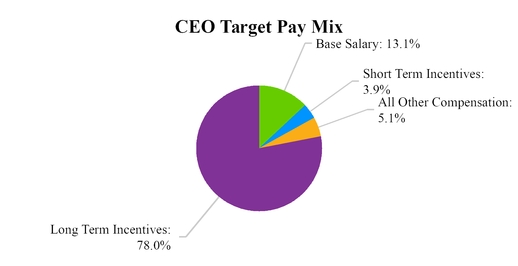
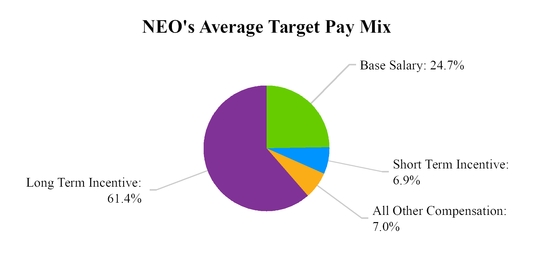
Compensation at Risk
The following pie charts show the relative weighting of Target pay for our CEO and the average for the other NEOs as a group for 2019:
12
Benchmarking of Cash Compensation
The table below shows the benchmarking data provided by the Committee's independent consultant, Pearl Meyer, based on U.S. benchmarking data for target total cash (Base Salary and 2019 STIP at Target). Pearl Meyer reviews LivaNova's compensation peer group to assess whether the roster remains appropriate for benchmarking executive compensation. The review is part of the annual process to maintain alignment between the Company and the companies with which the Company competes for talent. The Committee did not benchmark Messrs. Andrle and Simpson, as they became executive officers effective January 1, 2019. The Compensation Committee seeks to pay at the median but, as indicated below and in other benchmarking disclosure in this CD&A, Mr. Huston's compensation is above the median because we stretched to hire him from his former employer, Johnson & Johnson.
|
U.S. Target Total Cash Benchmark Percentile
|
|
|
Damien McDonald
|
69th
|
|
Thad Huston
|
>75th
|
|
Keyna Skeffington
|
51st
|
2019 Base Salary
The annual base salaries of our NEOs are an important part of their total compensation package and are intended to reflect their respective positions, duties and responsibilities. Base salaries help balance the incentive portions of the compensation program and
13
thereby provide stability and reduce the incentive for excessive risk-taking. The Compensation Committee reviews base salaries at the beginning of the year. In establishing base salaries, it considers the following factors:
|
•
|
Individual performance during the recently concluded financial year and potential future contribution;
|
|
•
|
Responsibilities, including any recent changes in those responsibilities;
|
|
•
|
Level of expertise and experience of the NEO compared to that required for a position;
|
|
•
|
Strategic importance of a position;
|
|
•
|
Internal pay equity among positions; and
|
|
•
|
Competitive benchmarking data.
|
Each of the NEOs is party to an employment agreement that provides for a specified base salary. That base salary is generally reviewed annually and serves as the baseline from which the calculations of certain other elements of compensation are made (e.g. under the STIP).
In February 2019, the Compensation Committee approved adjustments to the NEO’s base salaries effective April 1, 2019 as follows:
|
2019 Base Salary ($)
|
2018 Base Salary ($)
|
Change from 2018 (1)
|
|
|
Damien McDonald
|
933,202
|
933,202
|
0%
|
|
Thad Huston
|
516,674
|
492,754
|
5%
|
|
Keyna Skeffington
|
433,751
|
395,479
|
10%
|
|
Edward Andrle
|
440,000
|
400,000
|
10%
|
|
Alistair Simpson
|
433,751
|
395,479
|
10%
|
|
(1)
|
For salary amounts, we used an exchange rate of $1.275738014 per British Pound, each of which reflects the applicable period average published rate from our BOPC Accounting System between January 1, 2019 and December 31, 2019. The BOPC Accounting System uses Bloomberg as a source to obtain exchange rates.
|
The table below shows the benchmarking data provided by the Committee's independent consultant, Pearl Meyer, based on U.S. benchmarking data for target total cash (Base Salary and 2019 STIP at Target). Pearl Meyer reviews LivaNova's compensation peer group to assess whether the roster remains appropriate for benchmarking executive compensation. The review is part of the annual process to maintain alignment between the Company and the companies with which the Company competes for talent. The Committee did not benchmark Messrs. Andrle and Simpson, as they became executive officers effective January 1, 2019. The Compensation Committee seeks to pay at the median but, as indicated below and in other benchmarking disclosure in this CD&A, Mr. Huston's compensation is above the median because we stretched to hire him from his former employer, Johnson & Johnson.
|
U.S. Target Total Cash Benchmark Percentile
|
|
|
Damien McDonald
|
69th
|
|
Thad Huston
|
>75th
|
|
Keyna Skeffington
|
51st
|
2019 Short-Term Incentive Plan (the “2019 STIP”)
Our STIP is an annual cash-based incentive bonus plan and is an important component of our total compensation program. It provides incentives that compensate our executive officers for achieving objectives intended to enhance shareholder value. It also promotes retention of our NEOs.
Under English company law, we are obliged to adopt a remuneration policy for our directors, including our CEO, who is also a director. Under that shareholder-approved remuneration policy, our CEO's maximum short-term incentive opportunity cannot exceed 200% of his base salary. At present, Mr. McDonald's award under the STIP could exceed the 200% cap, but in the case of a calculated payment higher than 200%, the Compensation Committee would affirmatively act to reduce the award to not exceed 200% of his base salary in compliance with the UK remuneration policy.
The table below shows the minimum, Target and maximum achievement of the short-term incentive payment under the 2019 STIP:
14
|
Name
|
2019 STIP Minimum (Percentage of Base Salary)
|
2019 STIP Target (Percentage of Base Salary)(1)
|
2019 STIP Maximum (Percentage of Target)
|
|||
|
Damien McDonald
|
0
|
%
|
125
|
%
|
171
|
%
|
|
Thad Huston
|
0
|
%
|
90
|
%
|
160
|
%
|
|
Keyna Skeffington
|
0
|
%
|
70
|
%
|
160
|
%
|
|
Edward Andrle
|
0
|
%
|
65
|
%
|
156
|
%
|
|
Alistair Simpson
|
0
|
%
|
60
|
%
|
156
|
%
|
|
(1)
|
The Target Percentages for the following NEOs changed in 2019 as follows: Damien McDonald: 100% from January through March and increased to 125% effective April 1, 2019; Keyna Skeffington: 60% from January through March 31, 2019 and increased to 70% effective April 1, 2019; Ed Andrle: 60% from January through March 31, 2019 and increased to 65% effective April 1, 2019; and Alistair Simpson: 50% from January through March 31, 2019 and increased to 60% effective April 1, 2019.
|
2019 Short-Term Incentive Plan Pay-Out
Bonuses are based on performance over the calendar year, which is also our financial year, and are generally paid in April of the following year after completion of the audit of our annual financial statements.
Payouts under the 2019 STIP were based on the achievement of financial object
ives (Adjusted Net Sales and Adjusted Net Income at the Company level for Messrs. McDonald and Huston and Ms. Skeffington and comparable performance at the applicable franchise level for Messrs. Andrle and Simpson), eight non-financial objectives and, for all NEOs with the exception of Mr. McDonald, a leadership objective.
None of the financial objectives were achieved for the 2019 STIP and, consequently, the payout related to the financial objectives was zero for all our NEOs other than Mr. Simpson. The Compensation Committee determined that the performance of the Cardiovascular segment warranted recognition because the threshold was missed by a very slight margin and awarded Mr. Simpson a discretionary payment at the threshold level.
The non-financial objectives comprise product development projects that will drive revenue generation beyond 2019, plus a Leadership objective focused on developing our future leaders. The Design projects element was the completion of two product development projects, the Clinical projects element was achievement of enrollment objectives for two clinical studies, the Regulatory projects element included three regulatory submission objectives and a fourth project, and the Commercialization element was a commercial launch objective. Together, the nine product development project objectives represent 25% of each executive’s Target bonus, but total 40% if all objectives were achieved, representing a potential overachievement of 15%. The Leadership objective was valued at 15% for Mr. Huston and Ms. Skeffington and 20% for Messrs. Andrle and Simpson and could not be overachieved. The table below summarizes the Non-Financial objectives.
|
Non-Financial Objectives
|
|||||
|
Design
|
Clinical
|
Regulatory
|
Commercialization
|
Leadership
|
|
|
Damien McDonald
|
10%
|
10%
|
15%
|
5%
|
N/A
|
|
Thad Huston
|
10%
|
10%
|
15%
|
5%
|
15%
|
|
Keyna Skeffington
|
10%
|
10%
|
15%
|
5%
|
15%
|
|
Edward Andrle
|
10%
|
10%
|
15%
|
5%
|
20%
|
|
Alistair Simpson
|
10%
|
10%
|
15%
|
5%
|
20%
|
In 2019, all the non-financial objectives were achieved with the exceptions of one Regulatory project and the Commercialization element leading to a total achievement of 30% at Target. However, given the Company's overall financial results, the Compensation Committee reduced the payout under the STIP to 25% at Target. The Leadership objectives were achieved by each of the NEOs, but due to the Company's performance, management recommended and the Compensation Committee approved, that payout of this portion be at 80% of target for Mr. Huston and Ms. Skeffington and at 70% of target for Mr. Andrle and Mr. Simpson. Achievements for Mr. Andrle and Mr. Simpson were considered at 70% given their departures from their roles within the Company. This resulted in the following payouts in relation to the leadership objective: Mr. Huston at 80% (resulting in a payment of 12% of Target (80% of 15%)); Ms. Skeffington at 80% (resulting in a payment of 12% of Target (80% of 15%)); Mr. Andrle at 70% (resulting in a payout of 14% of Target (70% of 20%); and Mr. Simpson at 70% (resulting in a payment of 14% of Target (70% of 20%)).
The following table shows the percentage of achievement of the elements of the 2019 STIP and the amount paid to the NEOs under the STIP:
15
|
STIP Target (% of Base Salary) (1)
|
Financial Performance
Weight %
|
Weighted Financial Performance Payout %
|
Leadership Weight %
|
Leadership
Payout %
|
Weighted Non-Financial Performance
Payout %
|
STIP
Pay-Out %
|
STIP Payout ($)(2)
|
|
|
Damien McDonald
|
125%
|
75%
|
0%
|
NA
|
N/A
|
25%
|
25%
|
277,245
|
|
Thad Huston
|
90%
|
60%
|
0%
|
15%
|
12%
|
25%
|
37%
|
170,088
|
|
Keyna Skeffington
|
70%
|
60%
|
0%
|
15%
|
12%
|
25%
|
37%
|
106,289
|
|
Edward Andrle
|
65%
|
55%
|
0%
|
20%
|
14%
|
25%
|
39%
|
107,116
|
|
Alistair. Simpson
|
60%
|
55%
|
7.34%
|
20%
|
14%
|
25%
|
46%
|
113,445
|
|
(1)
|
The Target Percentages for the following NEOs changed in 2019 as follows: Damien McDonald: 100% from January through March and increased to 125% effective April 1, 2019; Keyna Skeffington: 60% from January through March 31, 2019 and increased to 70% effective April 1, 2019; Ed Andrle: 60% from January through March 31, 2019 and increased to 65% effective April 1, 2019; and Alistair Simpson: 50% from January through March 31, 2019 and increased to 60% effective April 1, 2019.
|
|
(2)
|
For payout amounts, we used an exchange rate of $1.275738014 per British Pound, each of which reflects the applicable period average published rate from our BOPC Accounting System between January 1, 2019 and December 31, 2019. The BOPC Accounting System uses Bloomberg as a source to obtain exchange rates.
|
2019 Long-Term Incentive Plan (the “2019 LTIP”)
The purpose of our LTIP is to promote our long-term success and enhance our value by providing employees with an incentive for outstanding performance to generate superior returns for our shareholders. The plan also provides flexibility as we seek to motivate, attract and retain the services of the NEOs upon whose judgment, interest and special effort the successful conduct of our operations is largely dependent.
We typically grant equity awards to executive officers under the 2019 LTIP on the same date we grant annual equity awards for other employees, or, in the event of an executive who joins after approval of the annual awards, at the first predetermined equity award grant date following the commencement of his/her employment with the Company. The predetermined quarterly grant dates are March 30, June 15, September 15 and December 15. There is no formal policy providing any affirmative right to an LTIP award, but when an LTIP award is granted, the award to our CEO in his capacity as an executive director of the Company, is circumscribed by any restrictions or limits in the Company's UK remuneration policy then in effect.
2019 LTIP Design
In March 2019, the Compensation Committee approved our 2019 LTIP in which all NEOs participate. Pursuant to the 2019 LTIP, the Committee approved an equity award value for each of four award vehicles for each participant with an effective date of March 30, 2019, as follows:
|
|
RSUs ($)
|
SARs ($)
|
rTSR PSUs ($)
|
FCF PSUs ($)
|
Total Award Value ($)
|
|
Damien McDonald
|
1,250,000
|
1,250,000
|
1,500,000
|
1,500,000
|
5,500,000
|
|
Thad Huston
|
500,000
|
500,000
|
500,000
|
500,000
|
2,000,000
|
|
Keyna Skeffington
|
225,000
|
225,000
|
225,000
|
225,000
|
900,000
|
|
Edward Andrle
|
187,500
|
187,500
|
187,500
|
187,500
|
750,000
|
|
Alistair Simpson
|
187,500
|
187,500
|
187,500
|
187,500
|
750,000
|
Service-Based Elements
:
Restricted Stock Units ("RSUs")
Each participant received an award of service-based RSUs vesting in equal or substantially equal amounts on each of the first four anniversaries of the grant date. The Committee determined the number of RSUs awarded to each participant by dividing the award value by the most recent closing price of an ordinary share of our stock on Nasdaq as of the grant date and rounding down to the nearest whole unit. The first vesting occurred on March 30, 2020.
Stock Appreciation Rights ("SARs")
Each participant received an award of SARs vesting in equal or substantially equal amounts on each of the first four anniversaries of
16
the grant date. The Committee determined the number of SARs awarded to each participant by dividing the award value by the Black-Scholes value of a SAR based on the most recent closing price of an ordinary share of our stock on the Nasdaq as of the grant date and rounding down to the nearest whole right. The first vesting occurred on March 30, 2020.
Performance-Based Elements
:
Relative Total Shareholder Return Performance Stock Units
Each participant received an award of Performance Stock Units ("PSUs") subject to a three-year relative total shareholder return (“rTSR”) market condition. The Compensation Committee determined the number of PSUs awarded to each participant by dividing the award value by the most recent closing price of an ordinary share of our stock on Nasdaq as of the grant date and rounding down to the nearest whole unit. At the end of calendar year 2021, our TSR for the three-year period 2019 through 2021 will be compared to the TSR for a group of 29 companies (the “2019 rTSR Comparator Group”) selected by the Committee’s compensation consultant, Pearl Meyer, and the number of shares of our stock actually delivered to the participants will be determined by the following chart, with linear interpolation applied between specified levels:
|
TSR Performance
Percentile Rank
|
Percent Funding for Objective
|
|
≥90
th
|
200%
|
|
80
th
|
150%
|
|
50
th
|
100%
|
|
30
th
|
40%
|
|
th
|
0%
|
The following companies comprise the 2019 rTSR Comparator Group:
|
ABIOMED, Inc.
|
Intuitive Surgical, Inc.
|
|
Baxter International Inc.
|
Invacare Corporation
|
|
Becton, Dickinson and Company
|
Masimo Corporation
|
|
Boston Scientific Corporation
|
Medtronic plc
|
|
Cantel Medical Corp.
|
Natus Medical Incorporated
|
|
CONMED Corporation
|
Nevro Corp.
|
|
DexCom, Inc.
|
Nuvasive, Inc.
|
|
Edwards Lifesciences Corporation
|
ResMed Inc.
|
|
Globus Medical, Inc.
|
Smith & Nephew plc
|
|
Haemonetics Corporation
|
Stryker Corporation
|
|
Hill-Rom Holdings, Inc.
|
Teleflex Incorporated
|
|
Hologic, Inc.
|
Varian Medical Systems, Inc.
|
|
Insulet Corporation
|
Wright Medical Group N.V.
|
|
Integer Holdings Corporation
|
Zimmer Biomet Holdings, Inc.
|
|
Integra LifeSciences Holdings Corp.
|
|
Adjusted Free Cash Flow PSUs
Each participant received an award of PSUs subject to achievement of a three-year cumulative adjusted free cash flow target (the “FCF Target”). The Compensation Committee determined the number of PSUs awarded to each participant by dividing the award value by the most recent closing price of an ordinary share of our stock on Nasdaq as of the grant date and rounding down to the nearest whole unit. At the end of calendar year 2021, cumulative adjusted free cash flow for the period 2019 through 2021 will be compared to the FCF Target, and the number of shares of our stock actually delivered to the participants will be determined by the following chart, with linear interpolation applied between specified levels:
17
|
FCF Achievement
Relative to FCF Target (1)
|
Percent Funding for Objective
|
|
≥150%
|
200%
|
|
125%
|
150%
|
|
100%
|
100%
|
|
60%
|
20%
|
|
|
0%
|
|
(1)
|
“Adjusted Free Cash Flow" is defined as the Company’s reported cash flow from operating activities (including ImThera and TandemLife), minus the Company’s reported capital expenditures, and excluding cash flows associated with restructuring, integration, 3-T heater cooler product remediation and significant and unusual litigation and cash paid or received for acquisitions (Caisson, ImThera, TandemLife and future acquisitions), divestitures (CRM and future divestitures) and settlements and judgments in significant and unusual litigation (including 3-T heater-cooler litigation).
|
Other Benefits and Perquisites
Our NEOs are provided with certain perquisites and other benefits to aid in the performance of their respective duties and to provide compensation competitive with that of executives with similar positions and levels of responsibilities in their respective geographies. These benefits may include housing allowance, expatriate school fees, car allowances, supplemental life insurance, supplemental health insurance, supplemental pension contributions, meal vouchers, childcare vouchers, gym membership and flexible benefit payments. Some of these are benefits received by all employees and so are not considered to be “perquisites” or “personal benefits” according to SEC rules, and so do not appear in the Summary Compensation Table under
All Other Compensation
. However, some of the NEOs’ benefits are not offered to all other employees (e.g. car allowance) and accordingly are considered “perquisites” or “personal benefits” that are reflected in the Summary Compensation Table under
All Other Compensation
and separately identified in footnotes as perquisites and other benefits.
Health/Welfare Plans
All of our full-time US-based employees, including Mr. Andrle, are eligible to participate in our health and welfare plans, including:
|
•
|
medical, dental and vision benefits;
|
|
•
|
medical and dependent care flexible spending accounts;
|
|
•
|
short-term and long-term disability insurance; and
|
|
•
|
group term life insurance.
|
Outside the US, our employees are generally covered by a state-run health plan and may be eligible to participate in a supplemental health plan, depending on their geography and position in the Company. Our NEOs based in the UK, Ms. Skeffington and Messrs. McDonald, Huston and Simpson, are eligible to receive Company-paid supplemental private health insurance, group term life insurance, disability insurance, a gym membership and, with exception of Mr. McDonald, tax assistance support.
2020 Compensation Program and Other Subsequent Events
Compensation Committee Actions - 2020
The Compensation Committee took the following actions in 2020:
|
•
|
Approved the 2020 STIP and the 2020 LTIP;
|
|
•
|
Reappointed Pearl Meyer as compensation advisors for the 2020 financial reporting year;
|
|
•
|
Approved base salaries and STIP percentages for all NEOs;
|
|
•
|
Approved the 2020 Peer Group; and
|
|
•
|
Reduced the 2019 STIP payout to 25% at Target given the Company's overall financial results. The 2019 STIP payout would otherwise have resulted in a 30% achievement at Target.
|
2020 Base Salary
On March 30, 2020, the Compensation Committee approved adjustments to the base salaries and Target percentages of Base Salary under the 2020 STIP for our executive officers, including the NEOs (other than Messrs. Andrle and Simpson who are no longer executive officers), effective as of April 1, 2020 as set forth below:
18
|
|
2020 Base Salary ($)
|
Increase from 2019
|
2020 STIP at Target
|
Change from 2019
|
|
Damien McDonald
|
979,862
|
5%
|
125%
|
—
|
|
Thad Huston
|
532,174
|
3%
|
90%
|
—
|
|
Keyna Skeffington
|
459,776
|
6%
|
70%
|
—
|
|
(1)
|
For salary amounts, we used an exchange rate of $1.275738014 per British Pound, each of which reflects the applicable period average published rate from our BOPC Accounting System between January 1, 2019 and December 31, 2019. The BOPC Accounting System uses Bloomberg as a source to obtain exchange rates.
|
2020 STIP
On March 30, 2020, the Compensation Committee also approved the 2020 STIP in which all NEOs participate (other than Messrs. Andrle and Simpson who are no longer executive officers). The 2020 STIP is the same as the 2019 STIP. The current target bonus percentage for each of the NEOs is the same as it was in the 2019 STIP:
|
2020 STIP Minimum (Percentage of Base Salary)
|
2020 STIP Target (Percentage of Base Salary)
|
2020 STIP Maximum (Percentage of Target)
|
|
|
Damien McDonald
|
0%
|
125%
|
171%
|
|
Thad Huston
|
0%
|
90%
|
160%
|
|
Keyna Skeffington
|
0%
|
70%
|
160%
|
Payment of the target bonus amount is conditioned on achievement of certain financial and non-financial objectives. If the threshold for a financial objective is achieved, then the funding for that objective is scaled down or up for underachievement or overachievement, respectively, of the objective, as follows:
|
Percent Achievement of Sales Objective
|
Percent Achievement of Income Objective
|
Percent Funding for Objective
|
|
>110%
|
>110%
|
175%
|
|
110%
|
110%
|
175%
|
|
|
Linear Interpolation: 1:7.50
|
|
|
100%
|
100%
|
100%
|
|
|
Linear Interpolation: 1:16.67 (Sales)
1.50 (Income)
|
|
|
97%
|
90%
|
50%
|
|
|
|
0%
|
The non-financial objectives comprise product development projects that will drive revenue generation beyond 2020, plus a Leadership objective focused on developing our future leaders. The Design projects include two product development projects, each valued at 5% if the objectives are achieved within defined timelines. The Clinical and Regulatory projects are enrollment objectives for three clinical studies, one of which is valued at 10% and the other two of which are valued at 5%. The achievement of one of these last two clinical studies is alternative to a regulatory submission objective. The Commercialization objective is a commercial launch objective valued at 10%. Together, the six product development project objectives represent 25% of each executive’s target bonus, but total 40% if all objectives are achieved, representing a potential overachievement of 15%. The Leadership objective is valued at 15% and cannot be overachieved.
|
|
Design
|
Clinical and Regulatory
|
Commercialization
|
Leadership
|
|
Damien McDonald
|
10%
|
20%
|
10%
|
NA
|
|
Thad Huston
|
10%
|
20%
|
10%
|
15%
|
|
Keyna Skeffington
|
10%
|
20%
|
10%
|
15%
|
2020 LTIP
On March 30, 2020, the Compensation Committee approved our 2020 LTIP in which all NEOs (other than Messrs. Andrle and Simpson who are no longer executive officers) participate. Pursuant to the 2020 LTIP, the Committee approved an equity award value for each of four award vehicles for each participant with an effective date of March 30, 2020, as follows:
19
|
RSUs ($)
|
SARs ($)
|
rTSR PSUs ($)
|
FCF PSUs ($)
|
|
|
Damien McDonald
|
1,500,000
|
1,250,000
|
1,500,000
|
1,500,000
|
|
Thad Huston
|
500,000
|
500,000
|
500,000
|
500,000
|
|
Keyna Skeffington
|
250,000
|
250,000
|
250,000
|
250,000
|
Service-Based Elements
:
RSUs
Each participant received an award of service-based RSUs vesting in equal or substantially equal amounts on each of the first four anniversaries of the grant date. The Committee determined the number of RSUs awarded to each participant by dividing the award value by the most recent closing price of an ordinary share of our stock on Nasdaq as of the grant date and rounding down to the nearest whole unit.
SARs
Each participant received an award of SARs vesting in equal or substantially equal amounts on each of the first four anniversaries of the grant date. The Committee determined the number of SARs awarded to each participant by dividing the award value by the Black-Scholes value of a SAR based on the most recent closing price of an ordinary share of our stock on Nasdaq as of the grant date and rounding down to the nearest whole right.
Performance-Based Elements
:
rTSR PSUs
Each participant received an award of PSUs subject to a three-year rTSR market condition. At the end of calendar year 2022, our TSR for the three-year period 2020 through 2022 will be compared to the TSR for a group of 30 companies (the “2020 rTSR Comparator Group”) selected by the Committee’s compensation consultant, Pearl Meyer, and the number of shares of our stock actually delivered to the participants will be determined by the following chart, with linear interpolation applied between specified levels.
|
TSR Performance
Percentile Rank
|
Percent Funding for Objective
|
|
≥90
th
|
200%
|
|
80
th
|
150%
|
|
50
th
|
100%
|
|
30
th
|
40%
|
|
th
|
0%
|
The following companies comprise the 2020 rTSR Comparator Group:
|
ABIOMED, Inc.
|
Intuitive Surgical, Inc.
|
|
Baxter International Inc.
|
Invacare Corporation
|
|
Becton, Dickinson and Company
|
Masimo Corporation
|
|
Boston Scientific Corporation
|
Medtronic plc
|
|
Cantel Medical Corp.
|
Natus Medical Incorporated
|
|
CONMED Corporation
|
Nevro Corp.
|
|
DexCom, Inc.
|
NuVasive, Inc.
|
|
Edwards Lifesciences Corporation
|
Penumbra Inc.
|
|
Globus Medical, Inc.
|
ResMed Inc.
|
|
Haemonetics Corporation
|
Smith & Nephew plc
|
|
Hill-Rom Holdings, Inc.
|
Stryker Corporation
|
|
Hologic, Inc.
|
Teleflex Incorporated
|
|
Insulet Corporation
|
Varian Medical Systems, Inc.
|
|
Integer Holdings Corporation
|
Wright Medical Group N.V.
|
|
Integra LifeSciences Holdings Corp.
|
Zimmer Biomet Holdings, Inc.
|
Adjusted Free Cash Flow PSUs
Each participant received an award of PSUs subject to achievement of a three-year cumulative adjusted FCF Target. At the end of calendar year 2022, cumulative adjusted free cash flow for the period 2020 through 2022 will be compared to the FCF Target, and the
20
number of shares of our stock actually delivered to the participants will be determined by the following chart, with linear interpolation applied between specified levels:
|
FCF Achievement
Relative to FCF Target
|
Percent Funding for Objective
|
|
≥150%
|
200%
|
|
125%
|
150%
|
|
100%
|
100%
|
|
60%
|
20%
|
|
|
0%
|
Other Benefits and Perquisites
The Compensation Committee did not make any changes to the benefits and perquisites provided to the NEOs in 2019.
Compensation Tables
2019 Summary Compensation Table
The following table contains information about the compensation earned by each of our NEOs during each of the last three financial years unless such individual was an NEO for fewer than three years.
|
Name and Principal Position
|
Year
|
Salary ($)(1)
|
Stock Awards ($)(2)
|
Option Awards ($)(2)
|
Non-Equity Incentive Plan Compensation ($)(1)(3)
|
All Other Compensation ($)(1)(4)
|
Total ($)
|
||||||
|
Damien McDonald
|
2019
|
933,202
|
|
4,309,277
|
|
1,249,978
|
|
277,244
|
|
362,226
|
|
7,131,927
|
|
|
Chief Executive Officer
|
2018
|
951,218
|
|
3,522,492
|
|
1,124,847
|
|
999,131
|
|
514,940
|
|
7,112,628
|
|
|
|
2017
|
847,925
|
|
2,350,821
|
|
—
|
|
848,095
|
|
1,368,920
|
|
5,415,761
|
|
|
Thad Huston
|
2019
|
510,694
|
|
1,519,670
|
|
499,998
|
|
170,088
|
|
139,192
|
|
2,839,642
|
|
|
Chief Financial Officer
|
2018
|
511,458
|
|
1,174,164
|
|
374,940
|
|
480,257
|
|
431,233
|
|
2,972,052
|
|
|
|
2017
|
296,759
|
|
3,158,878
|
|
—
|
|
269,641
|
|
157,907
|
|
3,883,185
|
|
|
Keyna Skeffington
|
2019
|
424,183
|
|
683,719
|
|
224,988
|
|
106,289
|
|
128,751
|
|
1,567,930
|
|
|
Senior Vice President, General Counsel and Corporate Secretary
|
2018
|
410,166
|
|
658,627
|
|
162,473
|
|
251,619
|
|
134,393
|
|
1,617,278
|
|
|
|
2017
|
215,599
|
|
274,962
|
|
258,412
|
|
118,407
|
|
108,865
|
|
976,245
|
|
|
Edward Andrle
|
2019
|
429,231
|
|
569,913
|
|
187,479
|
|
107,116
|
|
81,202
|
|
1,374,941
|
|
|
General Manager, NM
|
|
|
|
|
|
|
|
|
|
|
|
|
|
|
Alistair Simpson
|
2019
|
424,183
|
|
569,913
|
|
187,479
|
|
113,445
|
|
153,660
|
|
1,448,680
|
|
|
General Manager, CS
|
|
|
|
|
|
|
|
||||||
|
(1)
|
For amounts paid in salary and bonus compensation in 2019, we used an exchange rate of $1.275738014 per British Pound, which reflects the applicable period average published rate from our BOPC Accounting System between January 1, 2019 and December 31, 2019. The BOPC Accounting System uses Bloomberg as a source to obtain exchange rates. Salaries for our NEOs are reviewed and, if thought appropriate by the Compensation Committee, increased or decreased with effect on April 1st. The salaries indicated here thus reflect three months of the prior year's base salary and nine months of the new base
|
21
salary with effect from April 1st.
|
(2)
|
Amounts reflect the full grant-date fair value of RSUs and SARs granted computed in accordance with Federal Accounting Standards Board Accounting Standards Codification (“FASB ASC”) Topic 718, rather than the amounts paid to or realized by the named individual. We provide information regarding the assumptions used to calculate the value of all RSUs and SARs awards made to executive officers in Note 2 to our audited financial statements in our US Annual Report on Form 10-K for the year ended December 31, 2019. For additional information regarding the RSUs and SARs awards reported herein, see “—
Compensation Discussion and Analysis — 2019 Long-Term Incentive Plan
” and "—
Compensation Discussion and Analysis — 2019 Grants of Plan-Based Awards.
"
|
|
(3)
|
Values in this column reflect payments in respect of the relevant year's short-term incentive plan.
|
|
(4)
|
The amounts reported in the All Other Compensation column represent the aggregate dollar amount for all other benefits and payment received by our NEOs. The following table shows the nature of the benefits and payments and specific amounts for each of our NEOs in 2019:
|
|
|
Severance and Termination Payments
|
Supplemental Health Insurance
|
Housing Allowance
|
Car Allowance
|
Qualified Supplemental Pension Payments
|
Non-Qualified Deferred Compensation and Defined Contribution Plan Registrant Contributions
|
Cash in Lieu of Pension
|
Other
|
Total
|
|||||||||
|
($)
|
($)
|
($) (a)
|
($)(b)
|
($) (c)
|
($) (d)
|
($) (e)
|
($) (f)
|
($)
|
||||||||||
|
Damien McDonald
|
—
|
|
28,381
|
|
122,471
|
|
22,644
|
|
—
|
|
—
|
|
162,643
|
|
26,087
|
|
362,226
|
|
|
Thad Huston
|
—
|
|
21,823
|
|
—
|
|
16,840
|
|
—
|
|
—
|
|
89,360
|
|
11,169
|
|
139,192
|
|
|
Keyna Skeffington
|
—
|
|
34,628
|
|
—
|
|
16,840
|
|
—
|
|
—
|
|
69,922
|
|
7,361
|
|
128,751
|
|
|
Edward Andrle
|
—
|
|
26,215
|
|
—
|
|
—
|
|
11,200
|
|
40,222
|
|
—
|
|
3,565
|
|
81,202
|
|
|
Alistair Simpson
|
—
|
|
28,259
|
|
—
|
|
16,840
|
|
—
|
|
—
|
|
70,865
|
|
37,696
|
|
153,660
|
|
|
(a)
|
Represents the housing allowance to Mr. McDonald under the terms of his service agreement.
|
|
(b)
|
Represents the car allowance for each of Messrs. McDonald, Huston, Alistair and Ms. Skeffington. These benefits and allowances are customary in UK executive compensation packages.
|
|
(c)
|
Represents Company contributions on behalf of our NEOs to tax-qualified defined contribution plans. (
see - 2019 Pension Benefits
)
|
|
(d)
|
Represents Company contributions to a partially non-qualified defined contribution plan equal to the amount of company contributions made on behalf of the executive officer on top of the maximum amounts that may be tax-qualified under the supplemental pension plan. (
see - 2019 Nonqualified Deferred Compensation
)
|
|
(e)
|
Represents cash received in lieu of pension (
see - 2019 Pension Benefits
). In respect of Mr. McDonald: the Company contributed £20,000 ($25,215) into a personal pension plan administered by Aegon, and a further £127,490 ($162,643) was paid as cash in lieu of pension. Mr. McDonald's service agreement entitles him to a pension contribution equal to 15% of the aggregate of his base salary and bonus. As cash in lieu entails a UK employers' national insurance charge in the amount of 13.8% of the cash in lieu, the cash paid is decreased by this amount in order that the payment by the Company remains relatively cost-neutral. In respect of Mr. Huston, the Company contributed £70,046 ($89,360) as cash in lieu of pension. Mr. Huston's service agreement entitles him to a pension contribution equal to 15% of the aggregate of his base salary and bonus. As in the case of Mr. McDonald's cash in lieu, the cash paid is decreased by 13.8%. In respect of Ms. Skeffington, the Company contributed £54,809 ($69,922). Ms. Skeffington's service contract contains the same provision as Mr. Huston's and her cash in lieu is thus similarly reduced to reflect UK employers' national insurance contributions payable by the Company. In respect of Mr. Simpson, the Company contributed £55,548 ($70,865). Mr. Simpson's service contract contains the same provision as Mr. Huston and Ms. Skeffington and his cash in lieu is thus similarly reduced to reflect UK employers' national insurance contribution payable by the Company.
|
|
(f)
|
For Mr. McDonald, this represents a school tuition fee allowance for Mr. McDonald's children ($26,087). As to Mr. Huston, this represents gym membership ($2,373) and tax assistance ($8,796). As to Ms. Skeffington this represents tax assistance ($7,361). As to Mr. Andrle, this represents group term life insurance ($3,565). As to Mr. Simpson, this represents a school tuition fee allowance for Mr. Simpson's children ($29,770) and tax assistance ($7,926).
|
2019 Grants of Plan-Based Awards Table
The following table provides supplemental information relating to grants of plan-based awards made during 2019 to help explain information provided above in our Summary Compensation Table. This table presents information regarding all grants of plan-based awards occurring during 2019.
22
|
Name
|
Grant Date
|
Estimated Future Payouts Under Non-Equity Incentive Plan Awards
|
Estimated Future Payouts Under Equity Incentive Plan: Performance Stock Units (PSUs) (#)
|
All Other Stock Awards: Number of Shares of Service-Based RSUs (#)
|
All Other Option Awards: Number of Securities Underlying SARs (#)
|
Exercise or Base Price of SAR Awards ($/Sh)
|
|
Grant Date Fair value of RSU and SAR Awards ($)(1)(2)
|
|||||||||||||||
|
Threshold ($)
|
Target ($)
|
Maximum ($)
|
Threshold ($)
|
Target ($)
|
Maximum ($)
|
||||||||||||||||||
|
Damien McDonald
|
|
0
|
|
869,283
|
|
1,486,474
|
|
|
|
|
|
—
|
|
|
|
|
|||||||
|
|
03/30/2019
|
|
|
|
6,170
|
|
15,424
|
|
30,848
|
|
|
—
|
|
|
(2
|
)
|
1,559,339
|
|
|||||
|
|
03/30/2019
|
|
|
|
3,085
|
|
15,424
|
|
30,848
|
|
|
|
|
(2
|
)
|
1,499,984
|
|
||||||
|
|
03/30/2019
|
|
|
|
|
|
|
12,853
|
|
|
|
(1
|
)
|
1,249,954
|
|
||||||||
|
|
03/30/2019
|
|
|
|
|
|
|
|
39,357
|
|
97.25
|
|
(2
|
)
|
1,249,978
|
|
|||||||
|
Thad Huston
|
|
0
|
360,339
|
|
576,542
|
|
|
|
|
|
|
|
|
|
|||||||||
|
|
03/30/2019
|
|
|
|
2,056
|
|
5,141
|
|
10,282
|
|
|
—
|
|
|
(2
|
)
|
519,746
|
|
|||||
|
|
03/30/2019
|
|
|
|
1,028
|
|
5,141
|
|
10,282
|
|
|
|
|
(2
|
)
|
499,962
|
|
||||||
|
|
03/30/2019
|
|
|
|
|
|
|
5,141
|
|
|
|
(1
|
)
|
499,962
|
|
||||||||
|
|
03/30/2019
|
|
|
|
|
|
|
|
15,743
|
|
97.25
|
|
(2
|
)
|
499,998
|
|
|||||||
|
Keyna Skeffington
|
|
0
|
225,178
|
|
360,285
|
|
|
|
|
|
|
|
|
|
|||||||||
|
|
03/30/2019
|
|
|
|
925
|
|
2,313
|
|
4,626
|
|
|
—
|
|
|
(2
|
)
|
233,840
|
|
|||||
|
|
03/30/2019
|
|
|
|
463
|
|
2,313
|
|
4,262
|
|
|
|
|
(2
|
)
|
224,939
|
|
||||||
|
|
03/30/2019
|
|
|
|
|
|
|
2,313
|
|
|
|
(1
|
)
|
224,939
|
|
||||||||
|
|
03/30/2019
|
|
|
|
|
|
|
|
7,084
|
|
97.25
|
|
(2
|
)
|
224,988
|
|
|||||||
|
Edward Andrle
|
|
0
|
274,658
|
|
428,466
|
|
|
|
|
|
|
|
|
|
|||||||||
|
|
03/30/2019
|
|
|
|
771
|
|
1,928
|
|
3,856
|
|
|
—
|
|
|
(2
|
)
|
194,917
|
|
|||||
|
|
03/30/2019
|
|
|
|
386
|
|
1,928
|
|
3,856
|
|
|
|
|
(2
|
)
|
187,498
|
|
||||||
|
|
03/30/2019
|
|
|
|
|
|
|
1,928
|
|
|
|
(1
|
)
|
187,498
|
|
||||||||
|
|
03/30/2019
|
|
|
|
|
|
|
|
5,903
|
|
97.25
|
|
(2
|
)
|
187,479
|
|
|||||||
|
|
|
|
|
|
|
|
|
|
|
|
|
|
|||||||||||
|
Alistair Simpson
|
|
0
|
191,918
|
|
299,392
|
|
|
|
|
|
|
|
|
|
|||||||||
|
|
03/30/2019
|
|
|
|
771
|
|
1,928
|
|
3,856
|
|
|
—
|
|
|
(2
|
)
|
194,917
|
|
|||||
|
|
03/30/2019
|
|
|
|
386
|
|
1,928
|
|
3,856
|
|
|
|
|
(2
|
)
|
187,498
|
|
||||||
|
|
03/30/2019
|
|
|
|
|
|
|
1,928
|
|
|
|
(1
|
)
|
187,498
|
|
||||||||
|
|
03/30/2019
|
|
|
|
|
|
|
|
5,903
|
|
97.25
|
|
(2
|
)
|
187,479
|
|
|||||||
|
(1)
|
The amounts reported represent the fair value of the RSU and SARs awards computed in accordance with FASB ASC Topic 718 on the grant date. The fair value for RSU awards is calculated by multiplying the number of units in each award by the closing price of an ordinary share of our stock on Nasdaq on the grant date, eventually discounted in case of a market price condition. The fair value for SARs awards is calculated by multiplying the number of rights subject to the award by the Black-Scholes value of an option for an ordinary share of our stock on the grant date. For a further discussion of the accounting treatment of the RSU and SAR awards, see “Note 2. Basis of Presentation, Use of Accounting Estimates and Significant Accounting Policies” included in the consolidated financial statements accompanying our US Annual Report on Form 10-K for the year ended December 31, 2019.
|
|
(2)
|
The amounts reported represent the fair value of the PSU awards computed in accordance with FASB ASC Topic 718 on the grant date. LivaNova received a computed Fair Value from an outside source, MTI Consulting, that computed the Fair Value of the LivaNova PLC (LIVN) PSU contracts using the risk-neutral approach (i.e., assuming hedging and selling of the contract).
|
2019 Outstanding Equity Awards at Year End
The following table summarizes the number of ordinary shares of our stock underlying outstanding equity incentive plan awards for each NEO as of December 31, 2019.
|
|
Option Awards
|
Stock Awards
|
|||||||||||||||||
23
|
Name
|
Number of Securities Underlying Unexercised Options (#) Exercisable (1)
|
Number of Securities Underlying Unexercised Options (#) Unexercis-able (2)
|
Option Exercise Price ($)
|
Option Expiration Date
|
Number of Shares or Units of Stock That Have Not Vested (#)(3)
|
Market Value of Shares or Units of Stock That Have Not Vested ($)(4)
|
Equity Incentive Plan Awards: Number of Unearned Shares, Units or Other Rights That Have Not Vested
|
Equity Incentive Plan Awards: Market or Payout Value of Unearned Shares, Units or Other Rights That Have Not Vested
|
|||||||||||
|
Damien McDonald
|
87,114
|
|
43,556
|
|
44.79
|
|
11/4/2026
|
|
|
|
|
|
|||||||
|
|
10,378
|
|
31,134
|
|
88.38
|
|
3/15/2028
|
|
|
|
|
|
|
|
|
||||
|
|
—
|
|
39,357
|
|
97.25
|
|
3/30/2029
|
|
|
|
|
|
|
|
|
||||
|
|
|
|
|
|
|
|
16,744
|
|
(5
|
)
|
1,263,000
|
|
|
|
|
|
|||
|
|
|
|
|
|
|
|
26,704
|
|
(6
|
)
|
2,014,283
|
|
|
|
|
|
|||
|
|
|
|
|
|
|
|
8,901
|
|
(7
|
)
|
671,402
|
|
|
|
|
|
|||
|
|
|
|
|
|
|
|
9,546
|
|
(8
|
)
|
720,055
|
|
|
|
|
|
|||
|
|
|
|
|
|
|
|
12,853
|
|
(9
|
)
|
969,502
|
|
|
|
|
|
|||
|
|
|
|
|
|
|
|
|
|
|
|
12,729
|
|
(10
|
)
|
960,148
|
|
|||
|
|
|
|
|
|
|
|
|
|
|
|
12,729
|
|
(11
|
)
|
960,148
|
|
|||
|
|
|
|
|
|
|
|
|
|
|
|
15,424
|
|
(12
|
)
|
1,163,432
|
|
|||
|
|
|
|
|
|
|
|
|
|
|
|
15,424
|
|
(13
|
)
|
1,163,432
|
|
|||
|
Thad Huston
|
3,460
|
|
10,377
|
|
88.38
|
|
3/15/2028
|
|
|
|
|
|
|
|
|
||||
|
|
—
|
|
15,743
|
|
97.25
|
|
3/30/2029
|
|
|
|
|
|
|
|
|
||||
|
|
|
|
|
|
|
|
3,189
|
|
(14
|
)
|
240,546
|
|
|
|
|
|
|||
|
|
|
|
|
|
|
|
9,567
|
|
(15
|
)
|
721,639
|
|
|
|
|
|
|||
|
|
|
|
|
|
|
|
19,813
|
|
(16
|
)
|
1,494,495
|
|
|
|
|
|
|||
|
|
|
|
|
|
|
|
3,182
|
|
(8
|
)
|
240,018
|
|
|
|
|
|
|||
|
|
|
|
|
|
|
|
5,141
|
|
(9
|
)
|
387,786
|
|
|
|
—
|
|
|||
|
|
|
|
|
|
|
|
|
|
|
|
4,243
|
|
(10
|
)
|
320,049
|
|
|||
|
|
|
|
|
|
|
|
|
|
|
|
4,243
|
|
(11
|
)
|
320,049
|
|
|||
|
|
|
|
|
|
|
|
|
|
|
|
5,141
|
|
(12
|
)
|
387,786
|
|
|||
|
|
|
|
|
|
|
|
|
|
|
|
5,141
|
|
(13
|
)
|
387,786
|
|
|||
|
Keyna Skeffington
|
7,602
|
|
7,601
|
|
59.97
|
|
6/12/2027
|
|
|
|
|
|
|||||||
|
|
1,499
|
|
4,497
|
|
88.38
|
|
3/15/2028
|
|
|
|
|
|
|||||||
|
|
—
|
|
7,084
|
|
97.25
|
|
3/30/2029
|
|
|
|
|
|
|
|
|
||||
|
|
|
|
|
|
|
|
2,292
|
|
(17
|
)
|
172,886
|
|
|
|
|
|
|||
|
|
|
|
|
|
|
|
1,378
|
|
(8
|
)
|
103,943
|
|
|
|
|
|
|||
|
|
|
|
|
|
901
|
|
(18
|
)
|
67,962
|
|
|
|
|
|
|||||
|
|
|
|
|
|
2,313
|
|
(9
|
)
|
174,470
|
|
|
|
|
|
|||||
|
|
|
|
|
|
|
|
|
|
1,838
|
|
(10
|
)
|
138,640
|
|
|||||
|
|
|
|
|
|
|
|
|
|
|
|
1,838
|
|
(11
|
)
|
138,640
|
|
|||
|
|
|
|
|
|
|
|
|
|
|
|
2,313
|
|
(12
|
)
|
174,470
|
|
|||
|
|
|
|
|
|
|
|
|
|
|
|
2,313
|
|
(13
|
)
|
174,470
|
|
|||
|
Edward Andrle
|
29,717
|
|
0
|
|
69.39
|
|
10/19/2020
|
|
|
|
|
|
|
|
|
||||
|
|
1,724
|
|
5,169
|
|
88.38
|
|
3/15/2028
|
|
|
|
|
|
|
|
|
||||
|
|
—
|
|
5,903
|
|
97.25
|
|
3/30/2029
|
|
|
|
|
|
|
|
|
||||
|
|
|
|
|
|
|
|
10,416
|
|
(19
|
)
|
785,679
|
|
|
|
|
|
|||
|
|
|
|
|
|
|
|
1,375
|
|
(7
|
)
|
103,716
|
|
|
|
|
|
|||
24
|
|
|
|
|
|
|
|
4,127
|
|
(6
|
)
|
311,300
|
|
|
|
|
|
|||
|
|
|
|
|
|
|
|
1,590
|
|
(8
|
)
|
119,934
|
|
|
|
|
|
|||
|
|
|
|
|
|
|
|
1,928
|
|
(9
|
)
|
145,429
|
|
|
|
—
|
|
|||
|
|
|
|
|
|
|
|
|
|
|
|
2,121
|
|
(10
|
)
|
159,987
|
|
|||
|
|
|
|
|
|
|
|
|
|
|
|
2,121
|
|
(11
|
)
|
159,987
|
|
|||
|
|
|
|
|
|
|
|
|
|
|
|
1,928
|
|
(12
|
)
|
145,429
|
|
|||
|
|
|
|
|
|
|
|
|
|
|
|
1,928
|
|
(13
|
)
|
145,429
|
|
|||
|
Alistair Simpson
|
1,724
|
|
5,169
|
|
88.38
|
|
3/15/2028
|
|
|
|
|
|
|
|
|
||||
|
|
—
|
|
5,903
|
|
97.25
|
|
3/30/2029
|
|
|
|
|
|
|
|
|
||||
|
|
|
|
|
|
|
|
1,208
|
|
(7
|
)
|
91,119
|
|
|
|
|
|
|||
|
|
|
|
|
|
|
|
3,624
|
|
(6
|
)
|
273,358
|
|
|
|
|
|
|||
|
|
|
|
|
|
|
|
1,590
|
|
(8
|
)
|
119,934
|
|
|
|
|
|
|||
|
|
|
|
|
|
|
|
1,928
|
|
(9
|
)
|
145,429
|
|
|
|
|
|
|||
|
|
|
|
|
|
|
|
|
|
|
|
2,121
|
|
(10
|
)
|
159,987
|
|
|||
|
|
|
|
|
|
|
|
|
|
|
|
2,121
|
|
(11
|
)
|
159,987
|
|
|||
|
|
|
|
|
|
|
|
|
|
|
|
1,928
|
|
(12
|
)
|
145,429
|
|
|||
|
|
|
|
|
|
|
|
|
|
|
|
1,928
|
|
(13
|
)
|
145,429
|
|
|||
|
(1)
|
This column reflects SARs that are exercisable. The terms of the SARs stipulate that they may be exercised up to three months after a termination and in no event (even with continued employment) after the expiration date.
|
|
(2)
|
This column reflects SARs that are not yet exercisable as they have not yet vested. The SARs were granted with a vesting schedule over four years (25% per year.)
|
|
(3)
|
This column reflects RSUs that have not vested. All RSUs vest 25% per year on each of the first four anniversaries of the grant date.
|
|
(4)
|
Amounts reflect the market value of the outstanding RSUs. Amounts calculated using the closing price of our ordinary shares on December 31, 2019, or $75.43, multiplied by the number of units that have not yet vested.
|
|
(5)
|
Represents RSUs granted on November 4, 2016.
|
|
(6)
|
Represents PSUs granted on May 5, 2017. These PSUs had a market factor that was met on March 1, 2018, therefore the remaining shares are now service based. These PSUs vest 25% per year on each anniversary date of March 1, 2018.
|
|
(7)
|
Represents service based RSUs granted on May 5, 2017.
|
|
(8)
|
Represents service based RSUs granted on March 15, 2018.
|
|
(9)
|
Represents service based RSUs granted on March 30, 2019.
|
|
(10)
|
Represents PSUs granted on March 15, 2018. These PSUs are subject to achievement of a three-year cumulative adjusted free cash flow target (the "FCF Target"). This award has a three-year cliff vesting schedule.
|
|
(11)
|
Represents PSUs granted on March 15, 2018. These PSUs are subject to a performance or market condition based on a relative total shareholder return (rTSR). This award has a three-year cliff vesting schedule.
|
|
(12)
|
Represents PSUs granted on March 30, 2019. These PSUs are subject to achievement of a three-year cumulative adjusted free cash flow target (the "FCF Target"). This award has a three-year cliff vesting schedule.
|
|
(13)
|
Represents PSUs granted on March 30, 2019. These PSUs are subject to a performance or market condition based on a relative total shareholder return (rTSR). This award has a three-year cliff vesting schedule.
|
|
(14)
|
Represents service based RSUs granted on May 20, 2017.
|
|
(15)
|
Represents service based RSUs granted on May 20, 2017. These RSUs had a market factor that was met on March 1, 2018, therefore the remaining shares are now service based.
|
|
(16)
|
Represents service based RSUs granted on May 23, 2017.
|
|
(17)
|
Represents service based RSUs granted on June 12, 2017.
|
|
(18)
|
Represents service based RSUs granted on September 15, 2018.
|
|
(19)
|
Represents service based RSUs granted on March 11, 2016.
|
2019 Option Exercises and Stock Vested
The following table presents information regarding the vesting of RSUs in 2019 by our NEOs.
25
|
|
Stock Options
|
Stock Shares
|
||
|
Name
|
Number of LivaNova Option Shares Acquired on Exercise (#)
|
Value Realized on Exercise ($)
|
Number of LivaNova Shares Acquired on Vesting (#)
|
Value Realized on Vesting ($)
|
|
Damien McDonald
|
|
|
37,731
|
3,109,651
|
|
Thad Huston
|
|
|
17,346
|
1,382,921
|
|
Keyna Skeffington
|
|
|
1,907
|
152,963
|
|
Edward Andrle
|
29,718
|
156,614
|
9,621
|
902,900
|
|
Alistair Simpson
|
|
|
2,947
|
270,040
|
2019 Pension Benefits
The Company has no defined benefit plan applicable to our NEOs.
2019 Non-Qualified Deferred Compensation
One of our NEOs, Mr. Andrle, participated in a non-qualified deferred compensation plan in 2019 in which employees may defer up to 50% of their annual base salary and commissions and 100% of their bonus or performance-based compensation until the earlier of (i) termination of employment; or (ii) an elected distribution date. Employer contributions are provided to employees who defer into the plan, and for those employees who are legacy participants in the plan. For the plan year 2019, Mr. Andrle did not elect to defer into the plan and received an employer contribution of 6% of salary.
|
Name
|
Executive
Contributions
in
Last Fiscal Year
($)
|
Registrant
Contributions in
Last Fiscal Year
($) (1)
|
Aggregate
Earnings
in Last
Fiscal Year
($)
|
Aggregate
Withdrawals/
Distributions
in
Last Fiscal
Year
($)
|
Aggregate
Balance at
Last
Fiscal Year
($)
|
|||||
|
Edward Andrle
|
—
|
|
40,222
|
|
30,254
|
|
—
|
|
169,015
|
|
(1)
Represents Company contributions to the non-qualified defined contribution plan ($40,222) (
see - Summary Compensation Table
).
Potential Payments Upon Termination or Change in Control
The Compensation Committee's charter requires it to review and approve severance arrangements and change-in-control agreements. The employment agreements with the NEOs provide for severance payments and benefits in amounts that have been deemed appropriate by the Compensation Committee. The severance amounts take into account the time it is expected to take a separated employee to find alternative employment, as well as market practice for global executives.
At times, as circumstances dictate, we also enter into additional separation arrangements with departing executive officers. Employment agreements and any additional separation arrangements for departing NEOs are set out below.
Damien McDonald
Following Mr. McDonald's appointment as Chief Executive Officer with effect from January 1, 2017, the Compensation Committee on February 22, 2017 approved a service agreement with Mr. McDonald. Mr. McDonald's annual base salary was £731,500 ($933,202) as of April 1, 2019 and an opportunity to earn an annual cash incentive bonus with a target amount equal to 125% of his annual base salary (effective April 2019). In addition, we agreed to pay Mr. McDonald an annual housing allowance for a period of five years, commencing at £150,000 ($191,361) for 2017 and decreasing by £30,000 ($38,272) each year for the succeeding four years, an annual school allowance for a period of five years, commencing at £31,950 ($40,760) for 2017 and decreasing by £6,390 ($8,152) each year for the succeeding four years, an annual car allowance of £17,750 ($22,644) and pension contributions equal to 15% of the sum of his base salary and annual bonus under our STIP. Mr. McDonald is also eligible to participate in our employee benefit plans made available to all our UK-based employees. Mr. McDonald was also issued a letter dated February 22, 2017 confirming that the Company would recommend to the Compensation Committee annual equity awards but underscoring that any such awards remain in the absolute discretion of the Compensation Committee.
26
Certain provisions of Mr. McDonald's service agreement will continue in effect until the expiration of 12 months following notice of termination. The Company’s policy is not to have any notice period exceed 12 months.
The following table quantifies the potential payments that would be made to Mr. McDonald assuming a termination or change-in-control event had occurred on December 31, 2019.
|
Type of Payment or Benefit
|
Termination without Cause (1)
|
Separation due to Change in Control (2)
|
Separation due to Disability (3)
|
Separation due to Death (4)
|
Separation due to Retirement
|
|||||||||
|
Severance
|
$
|
933,202
|
|
—
|
|
—
|
|
$
|
3,732,809
|
|
—
|
|
||
|
STIP
|
—
|
|
—
|
|
—
|
|
—
|
|
—
|
|
||||
|
LTIP
|
—
|
|
$
|
6,972,797
|
|
$
|
1,334,556
|
|
$
|
1,334,556
|
|
—
|
|
|
|
Benefits
|
$
|
333,845
|
|
—
|
|
—
|
|
—
|
|
—
|
|
|||
|
Total
|
$
|
1,267,047
|
|
$
|
6,972,797
|
|
$
|
1,334,556
|
|
$
|
5,067,365
|
|
—
|
|
|
(1)
|
The potential payment in case of termination without cause represents 12 months of base salary ($933,202) and includes a cash amount representing the value of the following benefits for a period of 12 months: pension ($162,643), accommodation ($122,471), school allowance ($26,086), and car allowance ($22,644). The Company may elect to pay this severance amount in installments, and in this case, if Mr. McDonald secures alternative employment, then the gross installments payable after the date when alternative employment commences will be reduced by a sum equal to the gross amount of his income from the alternative employment. As to pension, this amount reflects 15% of Mr. McDonald's compensation (consisting of base).
|
|
(2)
|
The potential payment in case of separation due to change in control is calculated adding (i) the amount resulting from multiplying the 74,748 RSUs subject to accelerated vesting by the closing market price at December 31, 2019 ($75.43) and (ii) the amount resulting from multiplying each SARs award subject to accelerated vesting by the difference between the closing market price at December 31, 2019 ($75.43) and the exercise price for each SAR, as follows (43,556 SARs with an exercise price of $44.79). This does not include SARs where the exercise price exceeds the market price.
|
|
(3)
|
The potential payment amount in case of separation due to disability represents LTIP payments calculated by multiplying each SARs award subject to accelerated vesting in case of a disability by the difference between the closing market price at December 31, 2019 ($75.43) and the exercise price for each SAR, as follows (43,556 SARs with an exercise price of $44.79). This does not include SARs where the exercise price exceeds the market price.
|
|
(4)
|
The payment amount in case of separation due to death represents four times the base salary as a lump sum (payable by a third party insurer under a policy held by the Company for its employees) tax-free amount to the nominated person(s) plus LTIP potential payments in case of separation due to death calculated by multiplying each SARs award subject to accelerated vesting by the difference between the closing market price at December 31, 2019 ($75.43) and the exercise price for each SAR, as follows (43,556 SARs with an exercise price of $44.79).
|
|
(5)
|
For the amounts on this table, we used an exchange rate of $1.275738014 per British Pound, each of which reflects the applicable period average published rate from our BOPC Accounting System between January 1, 2019 and December 31, 2019.
|
Thad Huston
The Compensation Committee approved a service agreement between Mr. Huston and us effective as of May 20, 2017. Mr. Huston's annual base salary was £405,000 ($516,674) as of April 1, 2019 and an opportunity to earn an annual cash incentive bonus with a target amount equal to 90% of his annual base salary. In addition, we agreed to pay Mr. Huston an annual car allowance of £13,200 ($16,840) and pension contributions equal to 15% of the sum of his base salary and annual bonus. Mr. Huston is also eligible to participate in our employee benefit plans made available to all our UK-based employees. Certain provisions of Mr. Huston's service agreement will continue in effect until the expiration of 12 months following notice of termination. Mr. Huston was also issued a letter dated April 27, 2017 confirming that the Company would recommend to the Compensation Committee annual equity awards but underscoring that any such awards remain in the absolute discretion of the Compensation Committee.
The following table quantifies the potential payments that would be made to Mr. Huston assuming a termination or change-in-control event had occurred on December 31, 2019.
27
|
Type of Payment or Benefit
|
Termination Without Cause (1)
|
Separation due to Change in Control (2)
|
Separation due to Disability
|
Separation due to Death (3)
|
Separation due to Retirement
|
||||||||
|
Severance
|
$
|
516,674
|
|
—
|
|
—
|
|
$
|
2,066,696
|
|
—
|
|
|
|
STIP
|
—
|
|
—
|
|
—
|
|
—
|
|
—
|
|
|||
|
LTIP
|
—
|
|
$
|
3,084,484
|
|
—
|
|
—
|
|
—
|
|
||
|
Benefits
|
—
|
|
—
|
|
—
|
|
—
|
|
—
|
|
|||
|
Total
|
$
|
516,674
|
|
$
|
3,084,484
|
|
—
|
|
$
|
2,066,696
|
|
—
|
|
|
(1)
|
The potential payment in case of termination without cause represents 12 months of base salary ($516,674). The Company may elect to pay this severance amount in installments, and in this case, if Mr. Huston secures alternative employment, then the gross installments payable after the date when alternative employment commences will be reduced by a sum equal to the gross amount of his income from the alternative employment.
|
|
(2)
|
The potential payments in case of separation due to change in control are calculated adding the amount resulting from multiplying the 40,892 RSUs subject to accelerated vesting in case of a change in control by the closing market price at December 31, 2019 ($75.43) The SARs were underwater, therefore not part of this payout calculation).
|
|
(3)
|
The exercise price of the SARs was higher than the market price and, therefore, not part of this payout calculation.
|
|
(4)
|
The payment amount in case of separation due to death represents four times the base salary as a lump sum (payable by a third party insurer under a policy held by the Company for its employees) tax-free amount to the nominated person(s).
|
|
(5)
|
For the amounts on this table, we used an exchange rate of $1.275738014 per British Pound, each of which reflects the applicable period average published rate from our BOPC Accounting System between January 1, 2019 and December 31, 2019.
|
Keyna Skeffington
On May 24, 2017, we entered into a service agreement with Ms. Skeffington effective June 12, 2017. The agreement provides for an annual base salary in the amount of £300,000 ($382,721), increased to £340,000 ($433,751) as of April 1, 2019) and an opportunity to earn an annual cash incentive bonus with a target amount equal to 55% (increased to 70% in 2019) of her annual base salary. In addition, we agreed to pay Ms. Skeffington an annual car allowance of £13,200 ($16,840) and pension contributions equal to 15% of the sum of her base salary and annual bonus. Ms. Skeffington is also eligible to participate in our employee benefit plans made available to all our UK-based employees. The agreement will continue in effect until the expiration of 12 months following notice of termination. Ms. Skeffington also benefitted from certain relocation benefits under the agreement.
The following table quantifies the potential payments that would be made to Ms. Skeffington assuming a termination or change-in-control event had occurred on December 31, 2019.
|
Type of Payment or Benefit
|
Termination without Cause (1)
|
Separation due to Change in Control (2)
|
Separation due to Disability (3)
|
Separation due to Death (4)
|
Separation due to Retirement
|
||||||||
|
Severance
|
$
|
433,751
|
|
—
|
|
—
|
|
$
|
1,735,004
|
|
—
|
|
|
|
STIP
|
—
|
|
—
|
|
—
|
|
—
|
|
—
|
|
|||
|
LTIP (1)
|
—
|
|
$
|
695,535
|
|
—
|
|
$
|
176,275
|
|
—
|
|
|
|
Benefits
|
—
|
|
—
|
|
—
|
|
—
|
|
—
|
|
|||
|
Total
|
$
|
433,751
|
|
$
|
695,535
|
|
—
|
|
$
|
1,911,279
|
|
—
|
|
|
(1)
|
The potential payment in case of termination without cause represents 12 months of base salary ($433,571). We may elect to pay this severance amount in installments, and in this case, if Ms. Skeffington secures alternative employment, then the gross installments payable after the date when alternative employment commences will be reduced by a sum equal to the gross amount of her income from the alternative employment.
|
|
(2)
|
The potential payment in case of separation due to change in control is calculated by adding (i) the amount resulting from multiplying the 6,884 RSUs subject to accelerated vesting by the closing market price at December 31, 2019 ($75.43) and (ii) the amount resulting multiplying each SARs award subject to accelerated vesting by the difference between the closing market price at December 31, 2019 ($75.43) and the exercise price for each SAR, as follows (11,402 SARs with an exercise price of $59.97). This does not include SARs where the exercise price exceeds the market price.
|
28
|
(3)
|
The payment in case of separation due to death represents four times the base salary as a lump sum (payable by a third party insurer under a policy held by the Company for its employees) tax-free amount to the nominated person(s) plus LTIP potential payments calculated by adding the amount resulting from multiplying each SARs award subject to accelerated vesting by the difference between the closing market price at December 31, 2019 ($75.43) and the exercise price for each SAR, as follows (11,402 SARs with an exercise price of $59.97). This does not include SARs where the exercise price exceeds the market price.
|
|
(5)
|
For the amounts on this table, we used an exchange rate of $1.275738014 per British Pound, each of which reflects the applicable period average published rate from our BOPC Accounting System between January 1, 2019 and December 31, 2019.
|
Edward Andrle
On August 30, 2010, we entered into a service agreement with Mr. Andrle effective September 6, 2010. The agreement provides for an annual base salary in the amount of $333,000, which increased to $440,000 as of April 1, 2019 and an opportunity to earn an annual cash incentive bonus with a target amount equal to 65% of his annual base salary as of April1, 2019.
Effective January 1, 2020, Mr. Andrle resigned from his position as General Manager, Neuromodulation and assumed the position of Senior Advisor, continuing to be employed until June 30, 2020. In connection with Mr. Andrle's new role as Senior Advisor, the company will pay Mr. Andrle a salary in the amount of $440,000. Mr. Andrle will receive the 2019 STI bonus in April 2020. Mr. Andrle will receive a severance payment in the gross amount of $440,000 on the first payroll date following June 30, 2020. A payment for Restriction on Competition in the gross amount of $453,750 will be made on the first payroll date following February 15, 2021. Healthcare benefits will be reimbursed for a period of eight months measured from the termination date. Relocation expenses up to $25,000 will be reimbursed for expenses incurred in 2019 and 2020. Attorney fees up to $15,000 will be reimbursed for expenses related to the separation agreement.
The following table quantifies the potential payments that would be made to Mr. Andrle assuming a termination or change-in-control event had occurred on December 31, 2019.
|
Type of Payment or Benefit
|
Termination without Cause ($) (1)
|
Separation due to Change in Control (2)
|
Separation due to Disability
|
Separation due to Death (3)
|
Separation due to Retirement
|
||||||||
|
Severance
|
$
|
440,000
|
|
—
|
|
—
|
|
$
|
500,000
|
|
—
|
|
|
|
STIP
|
$
|
—
|
|
—
|
|
—
|
|
—
|
|
—
|
|
||
|
LTIP
|
$
|
—
|
|
$
|
1,466,057
|
|
—
|
|
—
|
|
—
|
|
|
|
Benefits
|
—
|
|
—
|
|
—
|
|
—
|
|
—
|
|
|||
|
Total
|
440,000
|
|
$
|
1,466,057
|
|
—
|
|
$
|
500,000
|
|
—
|
|
|
|
(1)
|
The potential payment in case of separation due to change in control is calculated by adding (i) the amount resulting from multiplying the 19,436 RSUs subject to accelerated vesting by the closing market price at December 31, 2019 ($75.43). The SARs that were underwater were not part of this payout calculation.
|
|
(2)
|
The payment in case of separation due to death represents a payment equal to 1.5 times base salary up to a maximum of $500,000 under a Company group life insurance policy.
|
Alistair Simpson
In February 2017, we entered into a service agreement with Mr. Simpson. The agreement provides for an annual base salary in the amount of £280,000, which increased to £340,000 as of April 1, 2019 and an opportunity to earn an annual cash incentive bonus with a target amount equal to 60% of his annual base salary as of April1, 2019.
Effective January 1, 2020, Mr. Simpson entered into a separation agreement with LivaNova as a transition into a new position and for eventual separation from the company. He resigned his position as General Manager, Cardiac Surgery and assumed the position of Vice President, Special Projects, continuing to be employed until June 30, 2021. His salary as Vice President, Special Projects is £340,000 ($433,751). Mr. Simpson will receive the 2019 STI bonus on April 2020. Mr. Simpson will receive a termination payment in the gross amount of £30,000 ($38,272). Relocation expenses up to £40,000 ($51,030) will be reimbursed for expenses incurred in 2019 and 2020. Attorney fees up to £5,000 ($6,379) will be reimbursed for expenses related to the separation agreement. Fees related to tax support or assistance for one year form the termination date will be reimbursed.
29
The following table quantifies the potential payments that would be made to Mr. Simpson assuming a termination or change-in-control event had occurred on December 31, 2019.
|
Type of Payment or Benefit
|
Termination without Cause ($)(1)
|
Separation due to Change in Control (2)
|
Separation due to Disability (3)
|
Separation due to Death (4)
|
Separation due to Retirement
|
|||||||||
|
Severance
|
$
|
433,751
|
|
—
|
|
—
|
|
$
|
1,735,004
|
|
—
|
|
||
|
STIP
|
—
|
|
—
|
|
—
|
|
—
|
|
—
|
|
||||
|
LTIP (1)
|
—
|
|
$
|
850,122
|
|
$
|
220,281
|
|
$
|
220,281
|
|
—
|
|
|
|
Benefits
|
—
|
|
—
|
|
—
|
|
—
|
|
—
|
|
||||
|
Total
|
$
|
433,751
|
|
$
|
850,122
|
|
$
|
220,281
|
|
$
|
1,955,285
|
|
—
|
|
|
(1)
|
The potential payment in case of termination without cause represents 12 months of base salary ($433,751). We may elect to pay this severance amount in installments, and in this case, if Mr. Simpson secures alternative employment, then the gross installments payable after the date when alternative employment commences will be reduced by a sum equal to the gross amount of her income from the alternative employment.
|
|
(2)
|
The potential payment in case of separation due to change in control is calculated by adding (i) the amount resulting from multiplying the 8,350 RSUs subject to accelerated vesting by the closing market price at December 31, 2019 ($75.43) and (ii) the amount resulting multiplying each SARs award subject to accelerated vesting by the difference between the closing market price at December 31, 2019 ($75.43) and the exercise price for each SAR, as follows (7,829 SARs with an exercise price of $56.17 and 4,816 SARs with an exercise price of $61). This does not include SARs where the exercise price exceeds the market price.
|
|
(3)
|
The potential payment in case of disability is calculated adding the amounts resulting from multiplying each SARs award subject to accelerated vesting by the difference between the closing market price at December 31, 2019 ($75.43) and the exercise price for each SAR, as follows (7,829 SARs with an exercise price of $56.17 and 4,816 SARs with an exercise price of $61). This does not include SARs where the exercise price exceeds the market price.
|
|
(4)
|
The payment in case of separation due to death represents four times the base salary as a lump sum (payable by a third party insurer under a policy held by the Company for its employees) tax-free amount to the nominated person(s) plus LTIP potential payments calculated by adding the amount resulting from multiplying each SARs award subject to accelerated vesting by the difference between the closing market price at December 31, 2019 ($75.43) and the exercise price for each SAR, as follows (7,829 SARs with an exercise price of $56.17 and 4,816 SARs with an exercise price of $61). This does not include SARs where the exercise price exceeds the market price.
|
|
(5)
|
For the amounts on this table, we used an exchange rate of $1.275738014 per British Pound, each of which reflects the applicable period average published rate from our BOPC Accounting System between January 1, 2019 and December 31, 2019.
|
CEO Pay Ratio
As required by Item 402(u) of Regulation S-K,
we are providing the following information:
F
or the year ended December 31, 2019:
–
the median of the annual total compensation of all employees of our company (other than the CEO), was $60,298; and
–
the annual total compensation of Mr. McDonald, our CEO, was $7,131,927.
Based on this information, the ratio of our annual total compensation of our CEO to the median of the annual total compensation of all employees is 118 to 1.
The methodology and material assumptions, adjustments, and estimates that we used to identify the median of the annual total compensation of all our employees, as well as to determine the annual total compensation of our median employee were as follows:
|
1.
|
As of October 1, 2019, our employee population consisted of 4,035 individuals working at our parent company and consolidated subsidiaries, with approximately 32% of these individuals located in the United States, 6% located in Canada, 52% located in Europe
,
and 10% located in various countries in Southeast Asia and South America.
|
30
|
◦
|
We selected October 1, 2019 to allow sufficient time to identify the median employee given the global scope of our operations.
|
|
2.
|
Our employee population, after taking into consideration the adjustments permitted by SEC rules (as described below), consisted of 3,810 individuals.
|
|
◦
|
Using the
de minimis
exception, we limited our employee population to individuals residing in Europe, North America, Japan and Australia.
|
|
◦
|
Given
the global distribution of our employee population, we have a variety of pay elements in the compensation arrangements of our
employees.
For example, while most of our employees participate in our short-term incentive plan, the incentive compensation element for some of our employees residing in the US, Japan and Europe is based on commissions. They do not participate in our short-incentive plan. Consequently, we selected base salary or wages plus overtime pay as the most appropriate consistently applied compensation measure to identify the median employee.
|
|
◦
|
We annualized the compensation of all permanent
employees
who were hired in fiscal 2019 but did not work for
us
or our consolidated subsidiaries for the
entire
fiscal year.
|
|
◦
|
We did
not make any cost-of-living adjustments in identifying
the median
employee.
|
|
3.
|
With respect to the annual total compensation of our CEO, we used the amount reported in
the
"Total" column of our 2019 Summary Compensation Table
included
in this proxy statement
. We applied the same approach to determine the annual total compensation of the identified median employee.
|
2019 Director Compensation Table
The Compensation Committee reviews the total compensation paid to our non-employee directors and non-executive chairman of our Board. The purpose of the review is to ensure that the level of compensation is appropriate to attract and retain a diverse group of directors with the breadth of experience necessary to perform our Board’s duties and to compensate our directors fairly for their services. The review includes the consideration of qualitative and comparative factors. To ensure directors are compensated relative to the scope of their responsibilities, the Compensation Committee considers the factors set out in the Company's remuneration policy which governs payments to all directors, including non-executive directors. Some of the factors considered include: the time and effort involved in preparing for Board and committee meetings and the additional duties assumed by committee chairs and the chairman of our Board; the level of continuing education required to remain informed of broad corporate governance trends and material developments relevant to strategic initiatives within our company; and the compensation paid to directors at a peer group of companies as determined by the Compensation Committee with advice from its compensation consultant.
In 2019, non-employee directors who served on the Company’s Board received the following fees paid in cash for their service on the Board:
|
•
|
annual board retainer fee of $110,000 ($185,000 for the Board Chair)
|
|
•
|
committee chair fees:
|
|
◦
|
$15,000 (Nominating and Corporate Governance Committee)
|
|
◦
|
$20,000 (Compensation Committee)
|
|
◦
|
$30,000 (Audit and Compliance Committee)
|
|
•
|
committee member fees (for members other than the committee chairs):
|
|
◦
|
$6,000 (Nominating and Corporate Governance Committee)
|
|
◦
|
$8,000 (Compensation Committee)
|
|
◦
|
$15,000 (Audit and Compliance Committee)
|
31
The non-executive directors, in 2019, were also granted RSUs with a grant date fair market value of $110,000 for each non-executive director ($185,000 for the Board Chair.) These are service-based awards that vest after one year. In the event of a termination prior to the end of a director’s term, these RSUs are prorated.
The following table sets forth a summary of the compensation we paid to our non-employee directors in the year ended December 31, 2019:
|
Name
|
Fees Earned or Paid in Cash ($)
|
Stock Awards ($)(1)
|
Total ($)
|
|||
|
Francesco Bianchi
|
133,000
|
|
109,890
|
|
242,890
|
|
|
William Kozy
|
116,000
|
|
109,890
|
|
225,890
|
|
|
Daniel Moore
|
185,000
|
|
184,908
|
|
369,908
|
|
|
Hugh Morrison
|
146,000
|
|
109,890
|
|
255,890
|
|
|
Alfred Novak
|
133,000
|
|
109,890
|
|
242,890
|
|
|
Sharon O’Kane
|
125,000
|
|
109,890
|
|
234,890
|
|
|
Arthur Rosenthal
|
130,000
|
|
109,890
|
|
239,890
|
|
|
Andrea Saia
|
125,000
|
|
109,890
|
|
234,890
|
|
|
Stacy Enxing Seng (2)
|
62,890
|
|
109,890
|
|
172,780
|
|
|
(1)
|
Amounts reflect the full grant-date fair value of RSUs granted in 2019 computed in accordance with FASB ASC Topic 718, rather than the amounts paid to or realized by the named individual. We provide information regarding the assumptions used to calculate the value of all stock awards and option awards made to our directors in “Note 2. Basis of Presentation, Use of Accounting Estimates and Significant Accounting Policies in the Company's US Annual Report on Form 10-K for the year ended December 31, 2019. The RSUs shown in the table will vest on the earlier of (i) June 18, 2020 and (ii) the date of a Change in Control. As of December 31, 2019, all RSU awards were unvested. The stock award values shown above correspond to the following number of RSUs: for Mr. Moore 2,524 RSUs; and for all other directors listed above, 1,500 RSUs.
|
|
(2)
|
Ms. Stacy Enxing Seng was elected to the Board at the 2019 AGM and was paid a pro rated cash retainer fee for 2019.
|
ITEM 12. SECURITY OWNERSHIP OF CERTAIN BENEFICIAL OWNERS AND MANAGEMENT AND RELATED STOCKHOLDER MATTERS.
Share Ownership Information
The following table sets forth, as of April 20, 2020, except where otherwise noted, certain information with respect to the amount of our ordinary share
s
beneficially owned by:
|
•
|
each of our NEOs;
|
|
•
|
each director;
|
|
•
|
all current executive officers and directors as a group; and
|
|
•
|
each person known by us to own beneficially more than 5% of the outstanding ordinary shares.
|
We are not aware of any agreements among our shareholders that relate to voting or investment of our ordinary shares.
32
|
Amount and Nature of Beneficial Ownership (1)
|
|||||||
|
Name of Beneficial Owner
|
Shares
Owned
|
Shares
Acquirable
Within 60 Days
|
Total Beneficial
Ownership
|
Percent of
Class
(2)
|
|||
|
Named Executive Officers:
|
|||||||
|
Damien McDonald
|
43,481
|
|
4,451
|
|
47,932
|
|
*
|
|
Edward Andrle
|
46,241
|
|
688
|
|
46,929
|
|
*
|
|
Thad Huston
|
20,910
|
|
11,502
|
|
32,412
|
|
*
|
|
Alistair Simpson
|
3,440
|
|
604
|
|
4,044
|
|
*
|
|
Keyna Skeffington
|
2,216
|
|
1,146
|
|
3,362
|
|
*
|
|
Directors:
|
|||||||
|
Francesco Bianchi
|
1,520
|
|
—
|
|
1,520
|
|
*
|
|
Stacy Enxing Seng
|
—
|
|
—
|
|
—
|
|
*
|
|
William Kozy
|
1,576
|
|
—
|
|
1,576
|
|
*
|
|
Daniel Moore (3)
|
28,352
|
|
—
|
|
28,352
|
|
*
|
|
Hugh Morrison (4)
|
1,520
|
|
—
|
|
1,520
|
|
*
|
|
Alfred Novak
|
9,570
|
|
—
|
|
9,570
|
|
*
|
|
Sharon O’Kane, Ph.D.
|
4,228
|
|
—
|
|
4,228
|
|
*
|
|
Arthur Rosenthal, Ph.D.
|
18,615
|
|
—
|
|
18,615
|
|
*
|
|
Andrea Saia
|
2,998
|
|
—
|
|
2,998
|
|
*
|
|
All current executive officers
|
184,667
|
|
18,391
|
|
203,058
|
|
*
|
|
and directors as a group (14
|
|||||||
|
persons)
|
|||||||
|
5% Holders: (5)
|
|||||||
|
BlackRock, Inc. (6)
|
5,954,330
|
|
—
|
|
5,954,330
|
|
12.05%
|
|
55 East 52nd Street
|
|||||||
|
New York, NY 10055
|
|||||||
|
Franklin Resources, Inc. (7)
|
3,348,444
|
|
—
|
|
3,348,444
|
|
6.78%
|
|
One Franklin Parkway
|
|||||||
|
San Mateo, CA 94403-1906
|
|||||||
|
T. Rowe Price Associates, Inc. (8)
|
2,766,521
|
|
—
|
|
2,766,521
|
|
5.60%
|
|
100 E. Pratt Street
|
|||||||
|
Baltimore, MD 21202
|
|||||||
|
Harris Associates L.P. (9)
|
2,697,007
|
|
—
|
|
2,697,007
|
|
5.46%
|
|
111. S. Wacker, Suite 4000
|
|||||||
|
Chicago, IL 60606
|
|||||||
|
PRIMECAP Management Company (10)
|
2,437,830
|
|
—
|
|
2,437,830
|
|
5.02%
|
|
177 E. Colorado Blvd., 11th Floor
|
|||||||
|
Pasadena, CA 91105
|
|||||||
* Less than 1%
|
(1)
|
Beneficial ownership is determined in accordance with the SEC’s rules and regulations and generally includes voting or investment power with respect to securities. LivaNova ordinary shares subject to options and warrants currently
exercisable, or exercisable within 60 days after April 20, 2020, are deemed outstanding for purposes of computing the percentage of shares beneficially owned by the person holding such rights, but are not deemed outstanding for computing the percentage of
|
33
any other person. Except as indicated by footnote, and subject to community property laws where applicable, the persons named in the table have sole voting and investment power with respect to all ordinary shares shown as beneficially owned by them. The address for each executive officer and director of the Company is 20 Eastbourne Terrace London W2 6LG, United Kingdom.
|
(2)
|
Based on total shares outstanding of 48,578,778 as of April 20, 2020.
|
|
(3)
|
The Total Beneficial Ownership column excludes 2,586 shares owned by the DJM Family Partnership, Ltd., in which Mr. Moore’s spouse, Grace M. Moore, owns a limited partner interest and holds sole investment power. Mr. Moore disclaims beneficial ownership over such shares.
|
|
(4)
|
1,520 shares owned by Mr. Morrison are pledged as collateral in connection with a margin account.
|
|
(5)
|
5% holders are as of April 28, 2020, as reported on Schedules 13G filed with the SEC.
|
|
(6)
|
The shares set forth in the table reflect the number of shares beneficially owned as of December 31, 2019, based on a Schedule 13G/A filed on February 4, 2020 by BlackRock, Inc. In such Schedule 13G/A, BlackRock, Inc. reported having sole voting power over 5,859,623 shares, shared voting power over no shares, sole dispositive power over 5,954,330 shares and shared dispositive power over no shares.
|
|
(7)
|
The shares set forth in the table reflect the number of shares beneficially owned as December 31, 2019, based on a Schedule 13G filed on February 5, 2020 by Franklin Resources, Inc. and its affiliates. In such Schedule 13G, Franklin Resources, Inc. and its affiliates reported having sole voting power over 2,419,644 shares, shared voting power over 38,000 shares, sole dispositive power over 3,310,444 shares and shared dispositive power over 38,000 shares.
|
|
(8)
|
The shares set forth in the table reflect the number of shares beneficially owned as December 31, 2019, based on a Schedule 13G filed on February 14, 2020 by T. Rowe Price Associates, Inc. In such Schedule 13G, T. Rowe Price Associates, Inc. reported having sole voting power over 828,934 shares, shared voting power over no shares, sole dispositive power over 2,766,521 shares and shared dispositive power over no shares.
|
|
(9)
|
The shares set forth in the table reflect the number of shares beneficially owned as December 31, 2019, based on a Schedule 13G filed on February 14, 2020 by Harris Associates L.P. In such Schedule 13G, Harris Associates L.P. reported having sole voting power over 1,845,813 shares, shared voting power over no shares, sole dispositive power over 2,697,007 shares and shared dispositive power over no shares.
|
|
(10)
|
The shares set forth in the table reflect the number of shares beneficially owned as March 31, 2020, based on a Schedule 13G filed on April 24, 2020 by PRIMECAP Management Company. In such Schedule 13G, PRIMECAP Management Company reported having sole voting power over 2,437,830 shares, shared voting power over no shares, sole dispositive power over 2,437,830 shares and shared dispositive power over no shares.
|
Equity Compensation Plan Information
The following table presents information as of December 31, 2019 regarding equity compensation plans applicable to our employees.
|
Plan category
|
Number of
securities
to be issued upon exercise of outstanding options, warrants and rights (#) |
Weighted-average
exercise price of outstanding
options,
warrants and rights ($) |
Number of
securities
remaining available for future issuance under equity compensation plans (#) |
||||||
|
Equity compensation plans approved by security holders
|
|||||||||
|
LivaNova PLC 2015 Incentive Award Plan and Sub-Plan(1)
|
2,788,448
|
|
77.06
|
|
4,903,894
|
|
|||
|
Cyberonics Legacy Plans(2)
|
235,844
|
|
52.10
|
|
1,855,720
|
|
|||
|
Equity compensation plans not approved by security holders
|
|||||||||
|
Cyberonics, Inc. New Employee Equity Inducement Plan(4)
|
290,185
|
|
|||||||
|
Total
|
3,024,292
|
|
64.58
|
|
7,049,799
|
|
|||
|
(1)
|
The LivaNova 2015 Incentive Award Plan and the Sub-Plan were approved by our Board and our sole shareholder, effective on October 16, 2015. Amounts represent the number of LivaNova Shares issuable upon the exercise or settlement
|
34
of outstanding SARs (1,979,011) and RSUs (809,437), as granted under the LivaNova 2015 Incentive Award Plan as of December 31, 2019.
|
(2)
|
The Cyberonics, Inc. Amended and Restated 1996 Stock Option Plan (“1996 Stock Plan”), the Cyberonics, Inc. Amended and Restated 1997 Stock Plan (“1997 Stock Plan”), the Cyberonics, Inc. 2005 Stock Plan (“2005 Stock Plan”) and the Cyberonics, Inc. 2009 Stock Plan (“2009 Stock Plan”) were approved by Cyberonics board and became effective in November 1996, November 2000, March 2005 and August 2009, respectively. Options granted under the 1996 Stock Plan (now expired), the 1997 Stock Plan (no longer available) and the 2005 Stock Plan (no longer available) generally vest ratably over four or five years following their date of grant. Option awards have a maximum term of 10 years from grant date. In connection with the merger of Sorin and Cyberonics, on October 19, 2015, we assumed the 1996 Stock Plan, 1997 Stock Plan, 2005 Stock Plan and the 2009 Stock Plan and all outstanding Cyberonics stock options granted thereunder (9,375; 102,121; 500; and 689,526, respectively), were fully vested, canceled and converted into an option to purchase one LivaNova Share. The amount represents the number of LivaNova Shares that may be issuable upon exercise of the converted option awards as of December 31, 2019. Based on the unused share reserve of the assumed Cyberonics, Inc. 2009 Stock Plan, there remain 1,855,720 LivaNova Shares available for issuance thereunder, as converted in connection with the above-described merger Transaction.
|
|
(3)
|
The Cyberonics, Inc. New Employee Equity Inducement Plan (“New Employee Plan”) was not approved by the shareholders of Cyberonics. The New Employee Plan provides for the award of unrestricted shares, restricted stock and stock options to newly hired Cyberonics employees. On October 19, 2015, we assumed the New Employee Plan and each outstanding Cyberonics stock option granted thereunder was fully vested, canceled and converted into an option to purchase one LivaNova Share. The amounts represent the number of LivaNova Shares that may be issuable upon exercise of the converted options and the total number of shares that remain available for issuance under the New Employee Plan as of December 31, 2019.
|
35
ITEM 13. CERTAIN RELATIONSHIPS AND RELATED TRANSACTIONS, AND DIRECTOR INDEPENDENCE.
Related Party Transactions
We recognize that related party transactions involving the Company present a heightened risk of conflicts of interest or the perception of such a conflict. The Board has a formal written policy for reviewing, approving and ratifying transactions with related persons.
Under the policy, any “Related Person Transaction” may be consummated or may continue only if the Audit and Compliance Committee approves or ratifies the transaction in accordance with the guidelines set forth in the policy.
For these purposes, a “Related Person” is:
|
•
|
a senior officer (which shall include, at a minimum, each executive officer/Section 16 officer) or director;
|
|
•
|
a shareholder owning more than 5% of the Company (or our controlled affiliates);
|
|
•
|
a person who is an immediate family member of a senior officer or director; and
|
|
•
|
an entity that is owned or controlled by someone listed above, or an entity in which someone listed above has a substantial ownership interest or control.
|
For these purposes, a “Related Person Transaction” is a transaction between the Company and any Related Person (including any transactions requiring disclosure under the Exchange Act), other than:
•
transactions involving compensation approved by the Compensation Committee;
•
transactions available to all employees generally; and
•
transactions involving less than $50,000 when aggregated with all similar transactions.
The Board has determined that the Audit and Compliance Committee is best suited to review and approve Related Person Transactions. Accordingly, in the event that management recommends a Related Person Transaction, management is required to present the transaction to the Audit and Compliance Committee in advance of entering into the transaction. If management is unable to present the transaction to the Audit and Compliance Committee for approval in advance, management may enter into the transaction preliminarily, subject to ratification by the Audit and Compliance Committee; provided, however, that if the Audit and Compliance Committee does not so approve, management must make all reasonable efforts to cancel or annul the transaction, or if unable to do so, to amend it in a satisfactory manner. The Audit and Compliance Committee may approve or ratify a Related Person Transaction only if the transaction is on terms comparable to those that could be obtained in arm’s-length dealings with an unrelated third party.
The Board recognizes that a member of our management team or a director may be presented with a significant business opportunity that may equally be available to the Company, either directly or via referral. Before the opportunity may be consummated by a Related Person (other than an otherwise unaffiliated 5% shareholder), the opportunity must be presented to the Audit and Compliance Committee for consideration. The Audit and Compliance Committee, in its discretion, may present the opportunity to the Board for consideration.
Since the beginning of the fiscal year ended December 31, 2019, there were no Related Person Transactions and no such transactions are currently proposed.
36
Director Independence
The Nominating and Corporate Governance Committee of the Board is empowered by its Board-approved charter to make all determinations of independence required under Nasdaq rules or other applicable laws and regulations, including but not limited to determinations as to which directors are independent, non-employee directors and "audit committee financial experts" as defined by US securities laws.
Under the Nasdaq listing rules, a majority of the members of our Board must qualify as “independent directors." An "independent director" for Nasdaq purposes is a person other than an executive officer or employee of the Company or any other individual having a relationship which, in the opinion of the Board, would interfere with the exercise of independent judgment in carrying out the responsibilities of a director.
The Nominating and Corporate Governance Committee has evaluated all relevant transactions and relationships between each director, or any of his or her family members, and the Company, senior management and our independent registered public accounting firm. Based on this evaluation, the Nominating and Corporate Governance Committee has determined that the following individuals, constituting a majority of the members of our Board, are “independent” as that term is defined in the Nasdaq listing standards and under the US securities laws:
•
Francesco Bianchi
•
Stacy Enxing Seng
•
William Kozy
•
Daniel Moore
•
Hugh Morrison
•
Alfred Novak
•
Sharon O’Kane
•
Arthur Rosenthal
•
Andrea Saia
The Board has also determined that all members of the Audit and Compliance Committee meet additional, heightened independence criteria applicable to audit committee members under the Nasdaq listing rules. The Board has further determined that all members of the Audit and Compliance Committee are financially literate and that Francesco Bianchi, Hugh Morrison (chair of the Audit and Compliance Committee) and Alfred Novak are “audit committee financial experts."
The Nominating and Corporate Governance Committee has also determined that all members of the Compensation Committee meet independence criteria applicable to compensation committee members under the Nasdaq listing rules as well as certain other requirements set out below.
The Nominating and Corporate Governance Committee's determinations as to Nasdaq independence, status as a non-employee director and status as an audit committee financial expert are set out in the table below.
|
Directors
|
Nasdaq "Independent Director"
|
Nasdaq Independence for Compensation Committee Purposes
|
"Non-Employee Director"
|
Audit Committee Financial Expert
|
|
Francesco Bianchi
|
X
|
X
|
X
|
X
|
|
Stacy Enxing Seng
|
X
|
X
|
X
|
|
|
William Kozy
|
X
|
X
|
X
|
|
|
Damien McDonald
|
||||
|
Daniel Moore
|
X
|
X
|
X
|
|
|
Hugh Morrison
|
X
|
X
|
X
|
X
|
|
Alfred Novak
|
X
|
X
|
X
|
X
|
|
Sharon O'Kane
|
X
|
X
|
X
|
|
|
Arthur Rosenthal
|
X
|
X
|
X
|
|
|
Andrea Saia
|
X
|
X
|
X
|
|
ITEM 14. PRINCIPAL ACCOUNTING FEES AND SERVICES.
37
Changes in Independent Auditor
PricewaterhouseCoopers S.p.A.
On March 23, 2018, the Audit and Compliance Committee formally dismissed PricewaterhouseCoopers S.p.A. ("PwC S.p.A." or the "Independent Auditor"), an Italian entity, as our independent registered public accounting firm and separately approved the engagement with that firm's US affiliate, PricewaterhouseCoopers LLP ("PwC USA"). This decision was made by the committee to better align with our restructuring and centralization of our accounting function in our Houston office, and we now believe it is most efficient to have an accounting firm local to that function. PwC S.p.A. was the auditor of one of our legacy companies, Sorin, which was based in Italy.
The reports of PwC S.p.A on our financial statements for the transitional period from April 25, 2015 to December 31, 2015 and for each of the years ended December 31, 2016 and December 31, 2017 did not contain an adverse opinion or a disclaimer of opinion, nor were they qualified or modified as to uncertainty, audit scope or accounting principles. During the transitional period from April 25 2015 to December 31, 2015 and during each of the years ended December 31, 2016 and 2017 and during the subsequent interim periods through the date of our Current Report on Form 8-K filed with the SEC on March 26, 2018:
|
•
|
there were no "disagreements" (as that term is defined in Item 304(a)(1)(iv) of SEC Regulation S-K and the instructions to Item 304) between us and PwC S.p.A. on any matters of accounting principles or practices, financial statement disclosure, or auditing scope or procedures, which disagreements, if not resolved to PwC S.p.A.'s satisfaction would have caused PwC S.p.A. to make reference to the subject matter of the disagreement(s) in connection with this report;
|
|
•
|
there were no "reportable events" (as that term is defined in Item 304(a)(1)(v) of SEC Regulation S-K); and
|
|
•
|
neither we nor anyone on our behalf consulted with PwC US regarding (i) the application of accounting principles to a specified transaction, either completed or proposed, or the type of audit opinion that might be rendered on our consolidated financial statement, and neither a written report was provided to us nor oral advice was provided that PwC USA concluded was an important factor considered by us in reaching a decision as to the accounting, auditing or financial reporting issues, or (ii) any matter that was either the subject of a disagreement (as that term is defined in Item 304(a)(1)(iv) of SEC Regulation S-K and the instructions to Item 304) or a reportable event (as defined in Item 304(a)(1)(v) of SEC Regulation S-K). We provided the disclosure required by Item 304 to PwC S.p.A. The letter received from PwC S.p.A. was filed as Exhibit 16.1 to the Current Report on Form 8-K that we filed with the SEC on March 26, 2018.
|
Fees Paid to PricewaterhouseCoopers
The following table summarizes the aggregate fees billed to us by PwC USA and its respective network member firms including PwC S.p.A. and the PricewaterhouseCoopers entity in the UK that acts as our UK statutory auditor (together, "PwC") for services performed in connection with the financial year ended December 31, 2019 and the financial year ended December 31, 2018:
|
Year Ended December 31, 2019
|
Year Ended December 31, 2018
|
|||||
|
(in thousands)
|
||||||
|
Audit Fees(1)
|
$
|
7,510
|
|
$
|
8,274
|
|
|
Audit-Related Fees(2)
|
-
|
|
$
|
18
|
|
|
|
Tax Fees(3)
|
$
|
443
|
|
$
|
387
|
|
|
All Other Fees(4)
|
1
|
|
$
|
1
|
|
|
|
Total
|
$
|
7,954
|
|
$
|
8,680
|
|
|
(1)
|
Audit Fees are fees we paid to PwC for professional services related to the audit of our annual financial statements and the review of our quarterly financial statements, and for services that are normally provided by the firm in connection with US or international statutory and regulatory filings or engagements.
|
|
(2)
|
Audit-Related Fees consist of aggregate fees to PwC for assurance services, other than those included in Audit Fees, related to the sale of our Cardiac Rhythm Management Business Franchise.
|
|
(3)
|
Tax Fees include applicable fees paid to PwC for tax services, including tax compliance and tax advice.
|
|
(4)
|
All Other Fees in 2019 and 2018 are for fees for disclosure checklist access.
|
Pre-Approval Policies and Procedures
The Audit and Compliance Committee has established an auditor independence policy that addresses the hiring of former employees of the Company's auditors as well as the provision by the auditors of audit and non-audit services. The policy sets out certain non-
38
audit services that are prohibited at all times as well as a separate list of services that may be permitted if approved by the Audit and Compliance Committee, subject to certain caps (expressed as a percentage of the average of all fees paid to the auditor in each of the prior three years). The committee may approve non-audit services in excess of this cap only if it concludes that the auditor is, or a reasonable investor with knowledge of all relevant facts and circumstances would conclude that the auditor is, capable of exercising objective and impartial judgment on all issues encompassed within the auditor's engagement. In this same policy, the committee also delegated approval authority to the committee's chair (or by resolution to any other member of the committee) to approve any one or more individual audit or permitted non-audit services for which estimated fees do not exceed $100,000. In such cases, the committee chair reports such approvals at the next scheduled meeting of the committee.
PART IV
|
ITEM 15.
|
EXHIBITS, FINANCIAL STATEMENT SCHEDULES.
|
The following Exhibits are filed as part of this Amendment as required by Regulation S-K.
39
SIGNATURES
Pursuant to the requirements of Section 13 or 15(d) of the Securities Exchange Act of 1934, the registrant has duly caused this report to be signed on its behalf by the undersigned, thereunto duly authorized.
Date: April 28, 2020
|
|
LIVANOVA PLC
|
|
|
|
|
|
|
|
By:
|
/s/ DAMIEN MCDONALD
|
|
|
|
Damien McDonald
|
|
|
|
Chief Executive Officer
|
|
|
|
(Principal Executive Officer)
|
|
|
LIVANOVA PLC
|
|
|
|
|
|
|
|
By:
|
/s/ THAD HUSTON
|
|
|
|
Thad Huston
|
|
|
|
Chief Financial Officer
|
|
|
|
(Principal Financial Officer)
|
40
EXHIBIT 31.1
CERTIFICATION
I, Damien McDonald, certify that:
1. I have reviewed this Amendment No. 1 to the Annual Report on Form 10-K for the year ended December 31, 2019 of LivaNova PLC; and
2. Based on my knowledge, this report does not contain any untrue statement of a material fact or omit to state a material fact necessary to make the statements made, in light of the circumstances under which such statements were made, not misleading with respect to the period covered by this report.
Date: April 28, 2020
|
|
LIVANOVA PLC
|
|
|
|
|
|
|
|
By:
|
/s/ DAMIEN MCDONALD
|
|
|
|
Damien McDonald
|
|
|
|
Chief Executive Officer
|
|
|
|
(Principal Executive Officer)
|
EXHIBIT 31.2
CERTIFICATION
I, Thad Huston, certify that:
1. I have reviewed this Amendment No. 1 to the Annual Report on Form 10-K for the year ended December 31, 2019 of LivaNova PLC; and
2. Based on my knowledge, this report does not contain any untrue statement of a material fact or omit to state a material fact necessary to make the statements made, in light of the circumstances under which such statements were made, not misleading with respect to the period covered by this report.
Date: April 28, 2020
|
|
LIVANOVA PLC
|
|
|
|
|
|
|
|
By:
|
/s/ THAD HUSTON
|
|
|
|
Thad Huston
|
|
|
|
Chief Financial Officer
|
|
|
|
(Principal Financial Officer)
|